


The price of Pi Coin has experienced a remarkable increase of 56% from its lowest point this year, entering a technical bull market even as the broader cryptocurrency landscape faces significant challenges. The Pi Network (PI) token reached $0.2010 on Friday, marking its highest value in over two weeks and reflecting a continued upward trend that began on March 10.
This bullish momentum appears to be fueled by the anticipation of key announcements coinciding with the upcoming Pi Day, celebrated annually on March 14. This day honors the mathematical constant pi and is often recognized through various educational activities and festivities, including pie-eating events. Historically, the Pi Network has utilized this occasion to unveil important updates and announcements.
In a recent communication, the development team expressed their hope to conclude the current phase of the Pi Network upgrade on Pi Day. Traders are speculating that additional significant news may also come on this date. For instance, there are rumors that Kraken, a well-known American cryptocurrency exchange, could announce a listing for Pi Coin, which was added to its listing roadmap earlier this year in February.
Other potential announcements include the introduction of a decentralized exchange, automated market maker, and token generation feature. The developers believe that these enhancements will cultivate increased demand for the token over time.
The rise in Pi Coin prices can also be attributed to investors capitalizing on the recent dip, following a significant decline in February. It is a common market behavior for investors to purchase assets that have dropped in value and to sell when prices are at a peak. A parallel can be drawn with Zcash (ZEC), which fell into a bear market after reaching its all-time high last year.
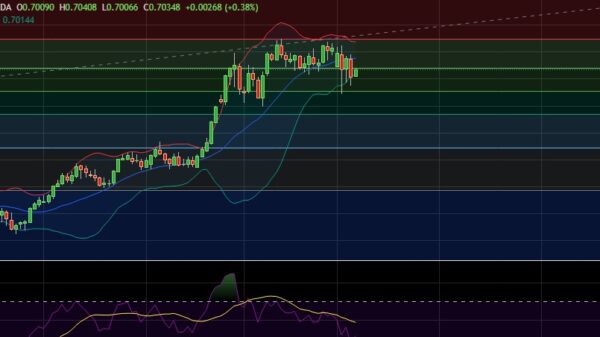
Analyzing the price chart reveals that Pi Coin has made a strong recovery from a low of $0.1300. This rebound has occurred despite the current downturn in the cryptocurrency market. The token has surpassed the critical resistance level indicated by the Murrey Math Lines tool, and it is now trading above the 50-period moving average. This crossing is generally interpreted as a continuation of the bullish trend.
Moreover, the Average Directional Index has climbed to 32, suggesting that the positive momentum is likely to persist in the near future as buyers aim for the next significant resistance level at $0.2500.