As Bitcoin (BTC) grapples with maintaining its position above the $100,000 threshold, concerns are escalating regarding a potential decline to the $50,000 level. Insights from OpenAI”s ChatGPT indicate that such a downturn may occur in the near future.
ChatGPT highlighted that Bitcoin is losing momentum, particularly after its inability to sustain levels above $110,000. The Relative Strength Index (RSI) is trending toward neutrality, with the price lingering just over its 200-day moving average (MA) around $87,000, suggesting a waning trend.
From a macroeconomic perspective, the AI pointed out that the cautious approach of the Federal Reserve regarding interest rate cuts and the tightening of liquidity could serve as a headwind for risk assets. Additionally, increasing exchange inflows indicate a rise in selling pressure among investors.
According to ChatGPT, should Bitcoin drop to $50,000, the cause would likely be a mix of tightening liquidity, outflows from exchange-traded funds (ETFs), profit-taking by institutions, and a breach of crucial support levels at $87,000 and $80,000. Such a scenario could trigger panic selling reminiscent of the downturns seen in 2018 and 2022.
The AI model suggests that the window from April to August 2026 appears to be the most likely timeframe for this crash, aligning with Bitcoin“s historical trend of peaks occurring 12 to 18 months post-halving. Following a projected peak in the range of $130,000 to $150,000, a typical correction of 60% to 70% could bring prices down to approximately $50,000.
However, ChatGPT also noted that if macroeconomic conditions stabilize, Bitcoin may experience a less severe pullback, potentially finding support in the $70,000 to $80,000 range before embarking on its next upward trajectory.
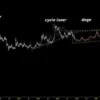
In terms of technical analysis, the prospect of Bitcoin plummeting to $50,000 is corroborated by various indicators. Analyst Ali Martinez, in a post on X dated November 11, indicated that the next significant market bottom for Bitcoin could materialize in about 328 days, suggesting a timeframe around October 2026.
Martinez”s analysis posits that Bitcoin is following a cyclical pattern akin to previous market cycles, characterized by peaks followed by extended periods of drawdown exceeding a year prior to recovery. The anticipated bottom range of $38,000 to $50,000 is consistent with retracement levels observed after earlier bull runs, implying that Bitcoin may continue to encounter gradual downward pressure as the current cycle progresses, potentially marking the conclusion of its post-halving rally phase.
As of the latest update, Bitcoin was trading at $103,411, reflecting a decline of approximately 1.4% within the past 24 hours. Over a weekly period, Bitcoin has registered a gain of 1.3%.
Currently, Bitcoin“s price is positioned below both the 50-day Simple Moving Average (SMA) at $112,216 and the 200-day SMA at $105,751, indicating a bearish trend in the short to medium term. The 50-day SMA serves as a resistance level, exerting downward pressure, while the slight cushion above the 200-day SMA keeps the long-term uptrend technically intact, albeit vulnerable.
Meanwhile, the 14-day RSI, currently at 47.76, reflects neutral conditions, indicating a lack of extreme momentum—neither oversold enough to prompt a significant rebound nor overbought to support additional selling.


