The price of Sui is currently maintaining a support level at $0.93 as two newly launched U.S. spot exchange-traded funds (ETFs) enter the market. As of the latest updates, Sui”s trading price stood at $0.9364, reflecting a decline of 3.3% within the past 24 hours. In the preceding week, the price fluctuated between $0.8991 and $1.04, with buyers consistently stepping in around the $0.90 mark.
Despite these attempts at recovery, the overall trend remains weak. Over the past month, Sui has experienced a dramatic drop of 40%, and a staggering 70% decline over the last year. Each effort to regain lost ground has faltered below previous highs, suggesting a lack of momentum.
In terms of derivatives, current positioning presents a mixed picture. Data from CoinGlass indicates that futures trading volume increased by 5% to $616.58 million, while open interest saw a decrease of 2.93%, settling at $493 million. This combination of rising volume alongside declining open interest typically suggests that traders are engaging in short-term positions rather than establishing a strong directional conviction.
The launch of the first U.S. spot SUI ETFs on February 18 included the Canary Staked SUI ETF (SUIS) from Canary Capital Group, which began trading on Nasdaq and incorporates staking of its holdings. Alongside this, Grayscale Investments debuted the Grayscale Sui Staking ETF (GSUI) on NYSE Arca. This fund features a 0.35% annual sponsor fee, which is waived for the first three months or until assets reach $1 billion, and at launch, all holdings were staked. These products hold actual SUI tokens and distribute staking rewards to investors.
The staking yield for Sui is approximately 7%, providing a dual advantage of benefiting from price movements and on-chain yield. Previous ETF launches for Bitcoin in 2024 and Ethereum in 2025 saw significant inflows, but it remains uncertain if SUI will enjoy similar demand. If these funds make further purchases of SUI tokens, it could provide upward support for the price. Conversely, lackluster participation may lead to limited impact.
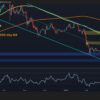
From a technical analysis perspective, the daily chart shows that the $0.93 to $0.90 range has been a pivotal support zone. The price has tested this area multiple times, with buyers stepping in to stabilize it. Should this support hold, short-term downward pressure might ease. The narrowing of the Bollinger Bands suggests a period of low volatility, often a precursor to larger price movements.
Currently, the relative strength index (RSI) is situated in the mid-30s, having recently recovered from oversold conditions near 25. A mild bullish divergence is visible, with the RSI forming a higher low while the price tested support. Although momentum is improving, it has not yet shifted to a bullish stance. Sui”s price continues to trade below the 20-day moving average, and lower highs have persisted since the rejection at approximately $2.00.
A significant indication of structural improvement would be a breakout above the $1.05 to $1.10 range. The key breakout zone lies between $1.15 and $1.20, aligning with previous breakdown levels and horizontal supply. A daily close above $1.20 could potentially disrupt the current lower-high pattern and pave the way toward price targets around $1.45 to $1.60. If the $0.93 support level fails, subsequent supports are positioned at $0.85 and $0.75. For the time being, Sui”s price is consolidating near this support as ETF catalysts emerge, with volume expansion above $1.05 to $1.20 likely determining the next trend direction.