The cryptocurrency market is currently experiencing a bearish trend, with Solana (SOL) showing signs of a significant decline. The overall market has faced a liquidity pullback and a reduction in market capitalization, following a 24-hour contraction. This situation has been accompanied by increased volatility, as short-term indicators suggest a fragile attempt to stabilize. Market sentiment remains largely negative, causing traders to proceed with caution.
In examining the broader market context, it is important to note that the daily regime for Solana is characterized by persistent selling pressure. At present, Bitcoin dominates the market with a 57.57% share, which means that substantial price movements are closely tied to Bitcoin”s performance. The global market capitalization sits at approximately $3.36 trillion, reflecting a decline of about 5.84% in the last 24 hours, indicating a risk-off sentiment among investors. The Fear & Greed Index, currently at 16, suggests an extreme fear level, with no trend confirmation as liquidity continues to exit the market.
From a technical perspective, the exponential moving averages (EMAs) on the daily chart are positioned well above the current price, with the EMA20 at 166.64, the EMA50 at 183.19, and the EMA200 at 187.33. This positioning indicates a strong downside bias, reinforcing a bearish market structure. The daily Relative Strength Index (RSI) is at 31.04, hovering just above oversold territory, suggesting limited potential for sellers to push prices lower without a corrective bounce. Furthermore, the Moving Average Convergence Divergence (MACD) indicator displays a line at -12.61, which is below the signal line at -10.80, coupled with a negative histogram of -1.81, indicating that selling momentum is still prevalent.
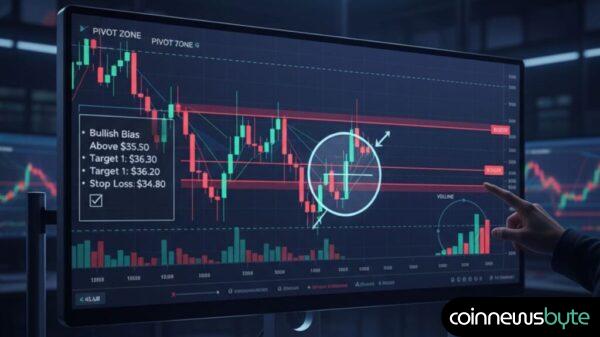
The Bollinger Bands midline is located at 170.87, with the lower band near 134.30, indicating that the current price is trading close to the lower limit of dispersion. This situation could either lead to a price squeeze or a continuation of the downtrend. The Average True Range (ATR) over the last 14 days is at 12.72, suggesting that traders should prepare for expanded volatility compared to more stable periods. Daily pivot points reveal a central pivot near 141.94, with an upside inflection around 145.16 and support located at 138.19. Currently, the price hovering around the pivot indicates market indecision; a decisive hold above this pivot could mitigate immediate downside risks, while a failure would reinforce the bearish sentiment.
On an intraday basis, the hourly EMAs also reflect a bearish scenario, with the EMA20 at 144.94 and the EMA50 at 149.70, while the closing price stands at 141.42. This alignment further supports the notion that short-term sellers are in control, consistent with the daily trend. The hourly RSI is at 34.04, indicating slightly less selling pressure than the daily timeframe. An analysis of the 15-minute chart reveals tighter clustering of the EMAs, with the close at 141.52 positioned near the short EMAs at 142.19. The 15-minute RSI reads 43.37, approaching neutral territory, suggesting that short-term traders might pursue minor bounce opportunities.
Key levels for the Solana price lie just above the pivot, where resistance near 142-145 may see sellers re-enter the market. Conversely, the 138 area, aligned with the daily S1 support, serves as a critical threshold; a breach here could lead to intensified selling pressure toward the daily lower Bollinger band. Recent decentralized exchange (DEX) fee trends on Solana exhibit mixed activity. While platforms like Raydium and HumidiFi have reported notable declines in fee flows, Orca and SolFi have registered sporadic increases, indicating uneven trading activity across different venues.
Looking ahead, the primary scenario for Solana is bearish, necessitating a sustained breakout above the EMA20 to shift this outlook and indicate potential trend improvement. Should sellers breach the 138 support level and the lower Bollinger band, expect selling momentum to accelerate and trading ranges to widen. For active traders, adopting smaller position sizes during periods of heightened volatility is advisable, utilizing pivot levels for potential entry points. Long-term investors may need to exercise patience until the price can reclaim higher EMAs and demonstrate consistent support.


