


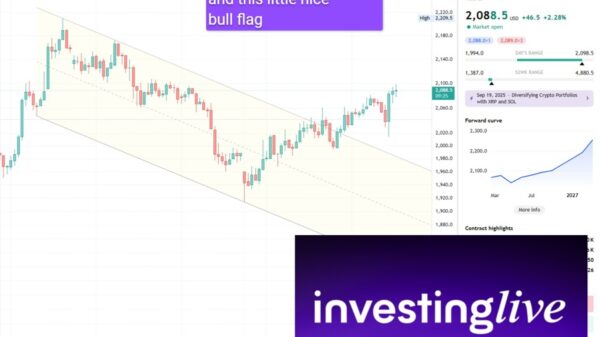


SOL has been experiencing a period of sideways movement, hovering around $127. The token is currently testing critical support at $125.32 and resistance at $130.30. This price action indicates a consolidation phase, as traders await clearer signals for the next directional move.
The Relative Strength Index (RSI) is showing low levels, suggesting that SOL may be oversold in the short term. Additionally, the Moving Average Convergence Divergence (MACD) has flashed a bullish signal, hinting at potential upward momentum. These technical indicators could point to a breakout in the coming 24 to 48 hours.
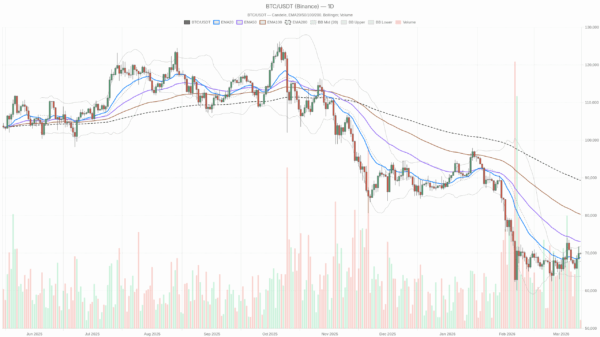
Moreover, the broader market dynamics, particularly the sideways movement of Bitcoin, are influencing SOL“s trading behavior. As Bitcoin stabilizes, it often sets the tone for altcoins, including SOL. Traders are closely monitoring these developments, as any significant movement from Bitcoin could trigger a corresponding response in SOL.
Investors should remain vigilant as these critical levels are approached, as they will likely determine the next phase of SOL”s price action. The combination of technical indicators and market sentiment suggests that a breakout, whether upward or downward, is imminent.