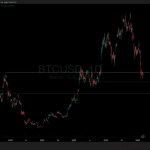


Litecoin (LTC) recently experienced a notable surge, briefly climbing above the moving average lines to a peak of $84.77. However, the upward momentum could not be sustained, as buyers failed to keep the price above the critical $85 threshold.
At present, Litecoin is trading within a narrow range, situated above the 50-day simple moving average (SMA) support but below resistance at $85. Should the 50-day SMA support hold firm, a potential rise to retest the $85 resistance could ensue. A successful breach of this level might see Litecoin aiming for a return to its previous high of $103. Conversely, if the 50-day SMA support is broken, the price could retreat to a range between the moving averages, with bearish momentum potentially driving it down towards the previous low of $72.
Analyzing the price indicators for Litecoin, it is evident that while the price remains above the downward-sloping moving average lines, the positive momentum has begun to wane. Currently, the price is finding support above the 50-day SMA, indicating a critical juncture. If Litecoin falls below this support, it may revert to its earlier trading range, specifically above $72.
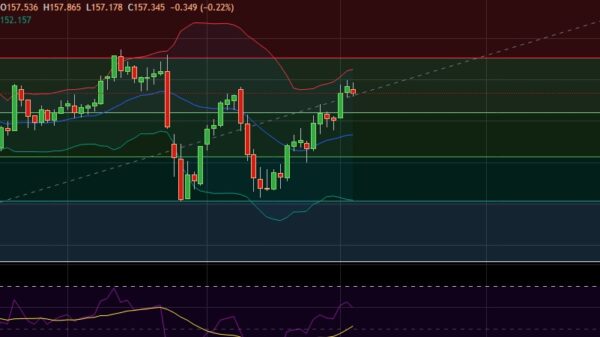
On the 4-hour chart, the price bars have dipped below the upward-sloping moving average lines, suggesting a continued decline may be possible. Since January 8, the price of Litecoin has been fluctuating, with recent bounces suggesting a strong support presence around the $80 mark. The trading activity shows significant buying pressure just above this level, as indicated by the extended candlestick tails.
In summary, Litecoin faces a pivotal moment as it strives to maintain its position above $80. The upcoming trading sessions will be crucial in determining whether it can regain momentum and challenge the $85 resistance, or if it will succumb to bearish pressures.