


The cryptocurrency market is witnessing a tightening of the Ethereum price as it continues to consolidate within the bounds of a symmetrical triangle pattern. Currently, the average acquisition cost for long-term holders of ETH is concentrated between $2,700 and $2,800, indicating a strong hold despite recent market fluctuations.
On January 8th, a significant outflow was recorded in the spot ETH exchange-traded funds (ETFs) totaling $159.2 million from U.S.-based providers. During the U.S. trading session on Friday, Ethereum experienced a minor decline of 0.68%, settling at approximately $3,083. This downturn in price can be attributed to broader market pullbacks coupled with substantial outflows from these ETFs, contributing to an emerging bearish trend that raises concerns about a potential drop below the $3,000 mark.
Recent on-chain data reveals that the accumulation addresses for ETH have stabilized around the $2,700 to $2,800 range, effectively establishing a structural cost zone for the asset. Analysis from crypto quant analyst Kripto Mevsimi shows that this cost base remains firm despite the volatility observed in the market. Since 2020, this metric has consistently trended upward, holding resilient through major market corrections, particularly during 2022 and 2023 when prices experienced notable declines.
At present, Ethereum trades between $3,084 and $3,100, approximately 10-15% above the established accumulation range. This metric serves as a testament to the conviction of committed holders, rather than a tool for pinpointing market highs or lows. In contrast, many other altcoins have struggled to find a stable cost foundation, leading to sharper declines and weaker recoveries.
Historically, this accumulation cost zone has shown resilience in withstanding downturns during various cycles of Ethereum, notably during the market events of 2018 and 2022. Nevertheless, persistent market dynamics raise concerns about the sustainability of this pattern, particularly if downward pressure continues for an extended period, which could alter holder behavior.
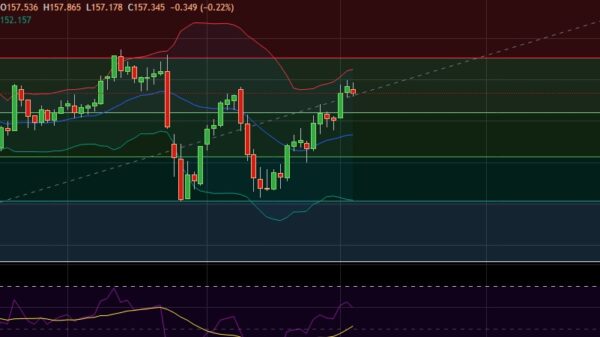
As we enter January, Ethereum remains within a narrow trading range, with attention focused on whether the $2,700-$2,800 band will serve as continued support amid larger market volatility. Daily chart analysis illustrates an ongoing consolidation trend for the Ethereum price, which has been evident since November 2021. The price has recently declined from $3,295 to the current level of $3,083, marking a 6.42% loss.
This downward movement suggests another bearish cycle within the symmetrical triangle, indicating that a lateral trend may continue as uncertainty prevails in the broader market. Should selling pressure persist, Ethereum might experience an additional 6% decrease, potentially testing the triangle”s lower trendline at $2,890. The current price remains below key exponential moving averages (50, 100, 200), reinforcing the prevailing bearish sentiment.
If a breakdown occurs, the price could further decline towards the significant support level of $2,600. Conversely, if Ethereum manages to breach the upper trendline of the triangle, it may signal the beginning of a recovery phase.