


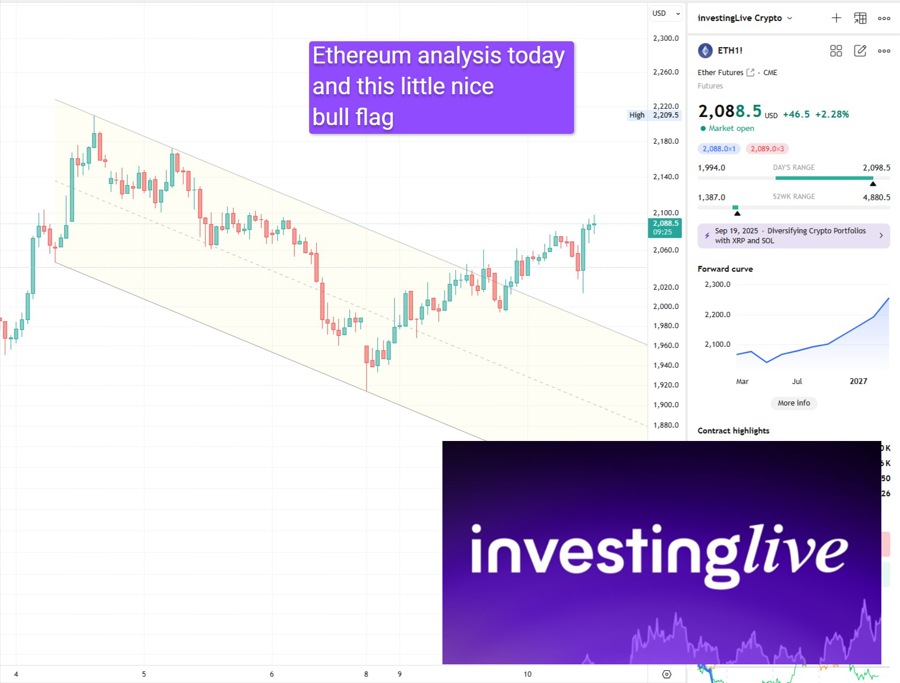
The latest analysis of Ethereum futures indicates a cautiously optimistic sentiment among traders as the cryptocurrency appears to be regaining higher value after facing selling pressure. Currently, Ethereum (ETH) is showing a +3.5 bullish bias on investingLive”s scale, suggesting that while there is a bullish edge, it does not yet indicate a strong, runaway trend.
Despite a broader market affected by surging oil prices and declining equity futures, Ethereum has demonstrated remarkable resilience, maintaining its position near the $2,000 mark. This stability follows a phase where order flow suggested a potential post-breakout rotation after reclaiming the psychological $2,000 level. Observers have noted a shift in internal market pressure from predominantly selling to buying, which points to a more structural move instead of a mere emotional rebound.
For traders, the lesson is clear: it is essential to look beyond individual opinions and focus on the evolving market structure. Recent price movements highlight the importance of recognizing significant volume profile levels and breakout patterns, especially as the market adapts to ongoing macroeconomic uncertainties.
Technical Analysis on the 4-Hour Chart
The 4-hour chart reveals a notable improvement in the Ethereum futures setup, primarily through a consistent rise in the Point of Control (POC). After an initial downturn that saw fair value drop toward $1,975 and even $1,935, Ethereum futures have been steadily rebuilding value, demonstrating a clear upward trajectory: $1,995, $2,025, $2,035, $2,045, $2,055, $2,065, and finally $2,085.
This gradual migration of the POC indicates that the market is increasingly accepting higher prices as fair value, a crucial sign for traders that bearish control is diminishing and a healthier market structure is emerging.
Price Predictions and Key Levels
The current outlook for Ethereum futures is moderately bullish but lacks definitive breakout confirmation. The market has shown improvement in its internal dynamics; however, the latest upward movement did not exhibit the decisive efficiency typically associated with stronger breakouts. While trading volume has increased, the net delta observed remains relatively modest, signifying acceptance of higher prices rather than overwhelming buyer dominance.
One significant indicator occurred around the $1,975 zone, where strong selling pressure was met with an inability to fully breakdown, leading to stabilization and a subsequent rise in value. This behavior indicates absorption, with passive buyers countering aggressive sellers, which contributes to the improved bullish score.
Crucial Support and Resistance Levels
Key levels to watch for Ethereum futures include:
- $2,085: This is the latest POC area and a critical reference point. Holding above this level maintains a bullish structure.
- $2,055-$2,065: This support band is vital for the ongoing 4-hour recovery. A failure to hold this zone would weaken the bullish setup.
- $2,110: This level acts as the first upside checkpoint. A significant move above it would suggest more than just a pause at higher prices.
- $2,125-$2,135: This area represents the next structural resistance. Reaching this zone with stronger volume would bolster the bullish argument.
- $1,985-$1,975: Should Ethereum futures breach the near-term support band, this lower range would be significant as a major absorption zone from earlier sell-offs.
In conclusion, while the Ethereum futures market has shown improved internal structures, it is not yet indicative of a euphoric breakout. The market is stabilizing at higher prices, and earlier selling pressure is losing its impact. Traders should closely monitor whether ETH can sustain above the $2,055-$2,065 range and gradually push through to $2,085 and beyond.
This report serves as a decision support tool rather than financial advice. As always, it is crucial for investors to conduct their own research and manage their risks effectively.