Ethereum has experienced a significant decline, with its price dropping by 6.11%, underperforming the overall cryptocurrency market, which saw a 4.89% decrease. This downturn is underscored by a wave of forced selling, particularly in the derivatives market, where approximately $600 million in crypto futures were liquidated within a day, including $148 million in ETH long positions.
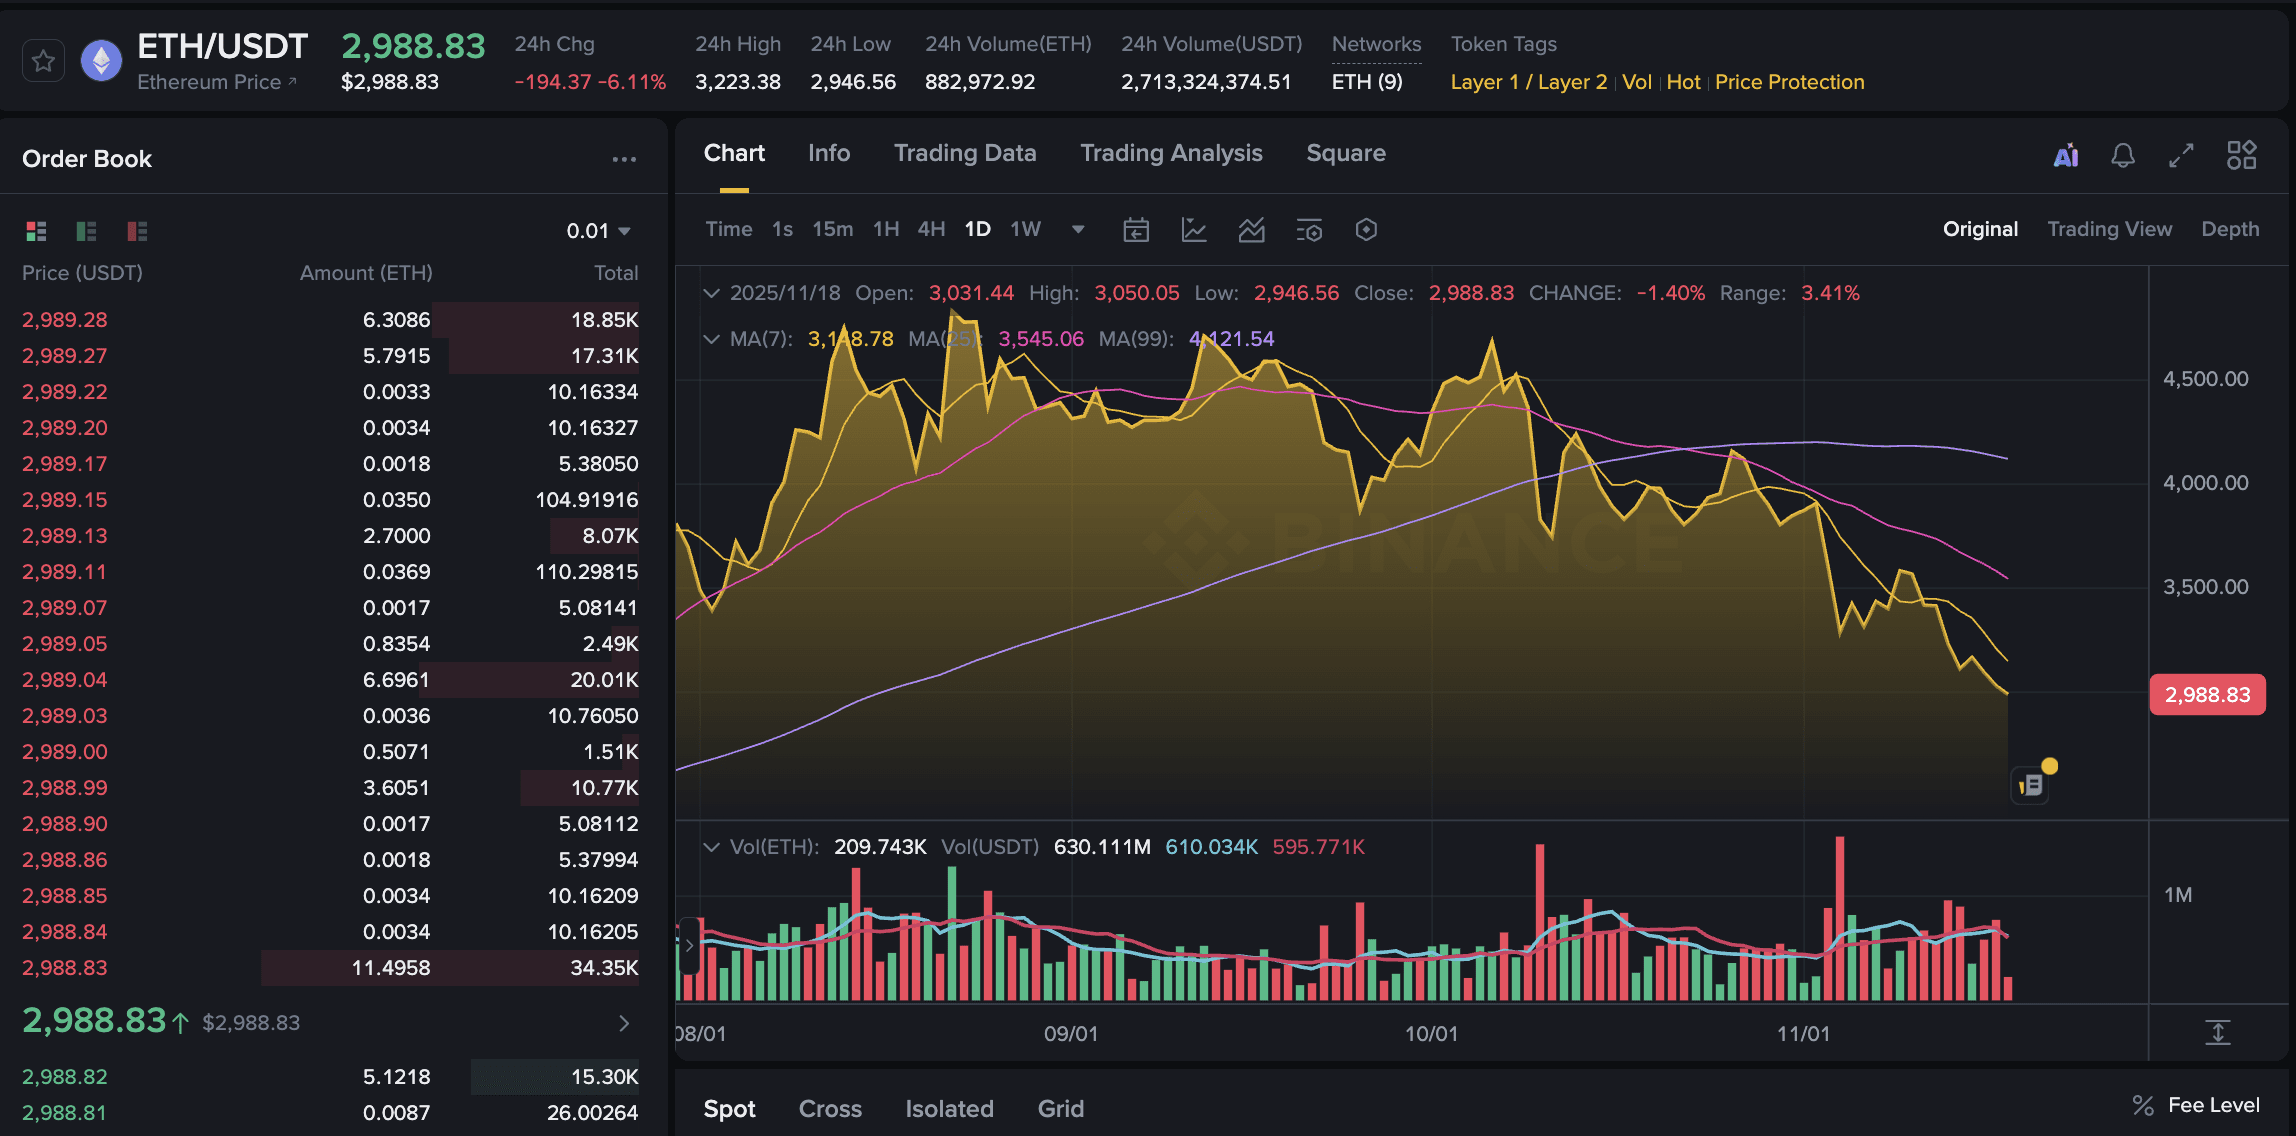
The current market dynamics suggest persistent bearish sentiment as leverage unwinding intensifies, driven by high leverage ratios often ranging from 25x to 100x. This has forced Ethereum to reach a 24-hour low near $2,988. The ongoing negative funding rates, recorded at –0.0019775% for leading altcoins, indicate that selling pressure is likely to continue, contributing to heightened volatility.
Institutional sentiment is also taking a hit, as evidenced by over $700 million in outflows from Ethereum ETFs last week, part of a larger trend that has seen a total of $3.2 billion exit the crypto exchange-traded products (ETP) market. This retreat points to a broader shift away from risk assets amid increasing concerns regarding Federal Reserve policy and slowing global economic growth.
Ethereum”s correlation of 0.82 with the Nasdaq means it is vulnerable to traditional market movements, particularly during risk-off scenarios. The significant discount of ETHE at –24.7% to its net asset value (NAV) highlights the adverse pressure on Ethereum, suggesting that negative sentiment may persist in the near term.
Technical indicators paint a challenging picture for Ethereum. Key metrics reveal a series of bearish signals. The relative strength index (RSI) stands at 30.5, indicating it is nearing oversold territory, but lacks the momentum for a rebound. The momentum indicator reads –408.2, reflecting strong negative acceleration, while the moving average convergence divergence (MACD) at –228.7 confirms a sustained downside bias. Additionally, the Williams %R indicator at –93.3 shows extreme selling pressure, illustrating a market struggling for stabilization.
Moreover, all major moving averages are consistently aligned downward, signaling a persistent downtrend. Ethereum has fallen below its 200-week moving average, approximately $3,234, and the 23.6% Fibonacci retracement level around $3,945, a combination historically associated with extended corrective phases.
Looking ahead, Ethereum is now trading beneath the critical breakdown level of $3,350, yet bears are facing challenges in pushing the price below the formidable support level of $3,000. This creates a narrow battleground for the cryptocurrency.
Key support levels to monitor include: $3,000 — a significant short-term support level, $2,956.90 — the recent low, and $2,900 — the cost basis for long-term holders. On the resistance front, the 20-day exponential moving average (EMA) at $3,444 constitutes the first major hurdle, while the 50-day simple moving average (SMA) at $3,871 marks the threshold where broader trend shifts may occur.
A sharp rejection at the 20-day EMA could heighten the risk of breaking below $3,000, potentially paving the way toward $2,500. Conversely, a robust close above the 50-day SMA could indicate that the current correction is losing momentum.