


Ethereum is currently navigating a broader corrective phase, trading beneath crucial moving averages and within a clearly defined descending structure. While there are signs of short-term stabilization near support levels, the prevailing trend on higher timeframes remains bearish unless significant resistance levels are reclaimed with notable momentum.
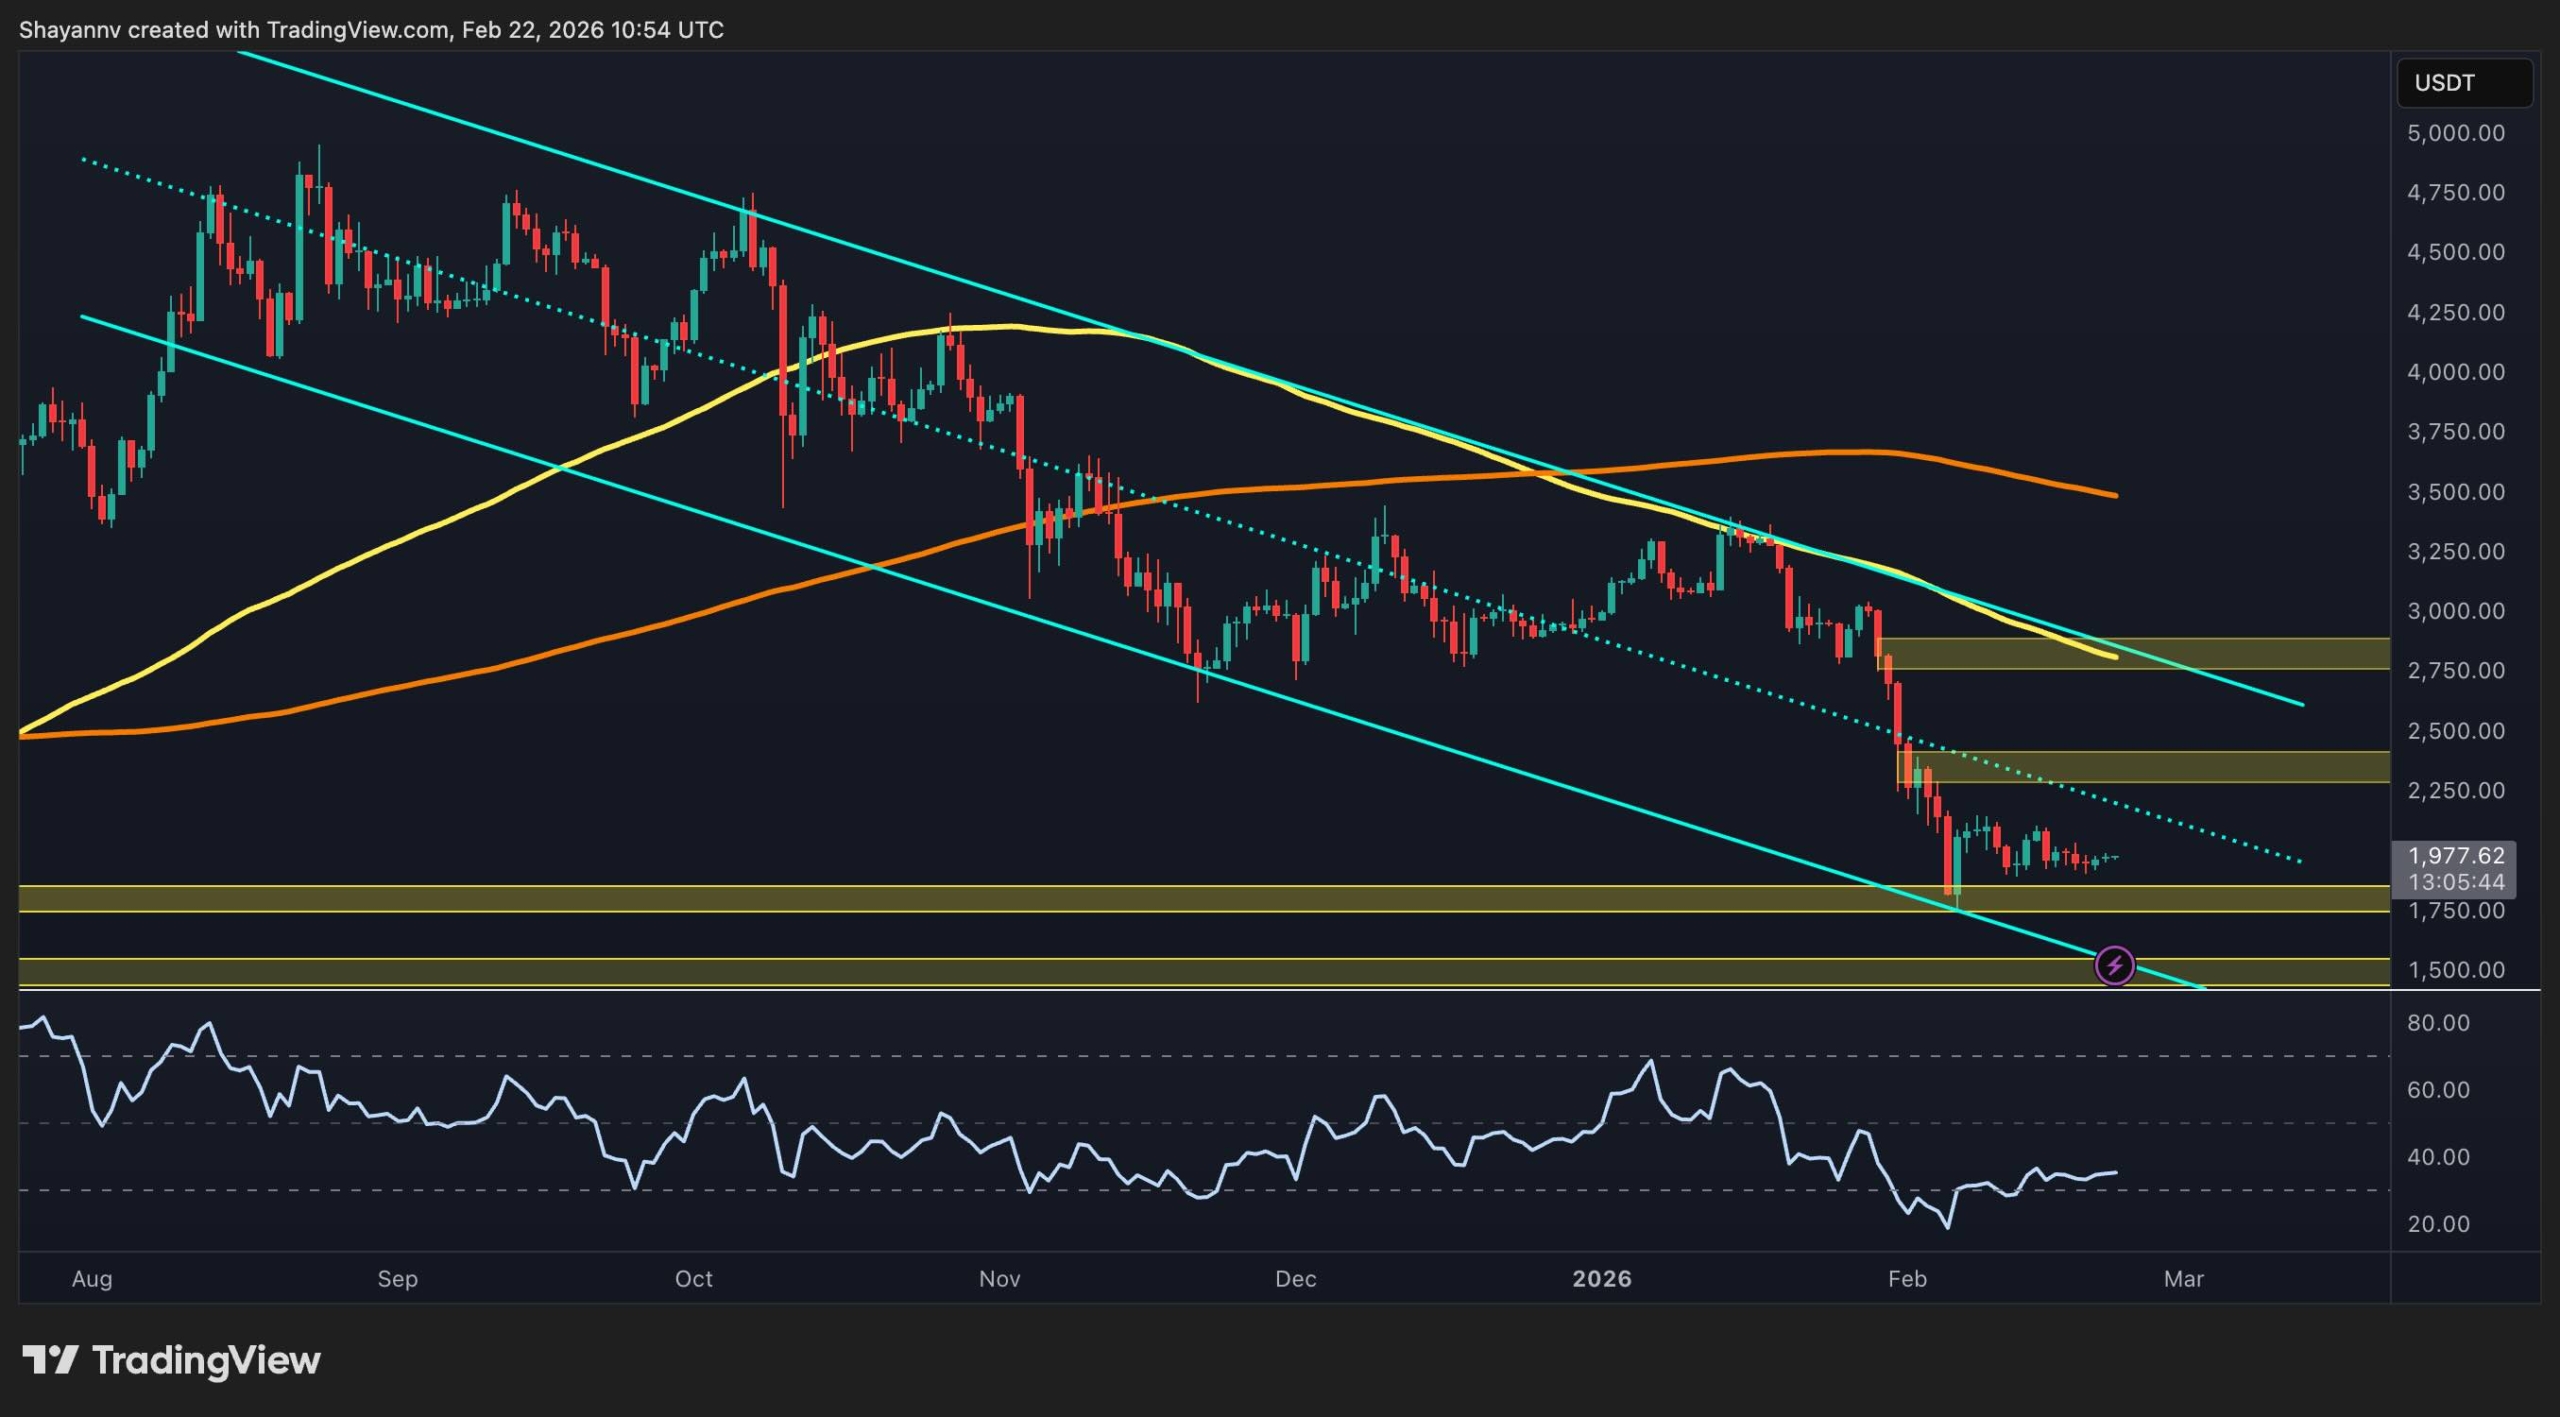
On the daily chart, ETH continues to adhere to a descending channel, consistently producing lower highs below both the 100-day and 200-day moving averages. A recent price drop has driven the asset into the $1,750 to $1,800 demand zone, where buying interest has emerged to slow the decline. However, the overall structure still leans toward bearishness. The $2,300 to $2,400 area now serves as a key resistance cluster, coinciding with previous breakdown points and just below the declining 100-day moving average. Without a reclaim of this zone and a break above the channel”s upper boundary, any rallies are likely to be corrective, with the potential for another downturn toward lower channel support.
Examining the 4-hour chart reveals that the asset has been compressing within a symmetrical triangle, characterized by recent lower highs and higher lows, situated above the horizontal support level of $1,800. This short-term consolidation reflects market indecision rather than a confirmed reversal, as lower highs continue to be established. A breakout above the $2,000 to $2,100 range would signal a potential shift in short-term momentum and could pave the way for a move toward the resistance band of $2,300 to $2,400. Conversely, if the $1,800 support is breached, it would invalidate the current consolidation thesis and likely trigger renewed selling pressure targeting deeper support levels.
On-chain analysis indicates a sharp increase in network activity, with the 30-day exponential moving average (EMA) of active addresses reaching multi-month highs. Historically, such spikes in activity have coincided with heightened volatility and often precede significant directional shifts. Despite this increase in participation, the market has yet to confirm a bullish reversal, suggesting that while engagement is rising, capital flows are not decisively pushing prices higher. This pattern may indicate panic selling at lower price points by less experienced investors. If the elevated activity continues while prices stabilize, it could potentially create a constructive base; however, a clear break above key resistance levels is necessary for confirmation.