


Ethereum is approaching a pivotal moment as it navigates a landscape marked by over $1 billion in liquidations. This development comes amid expectations of increased volatility triggered by upcoming macroeconomic indicators, including U.S. unemployment data and a Supreme Court ruling related to tariffs from the previous administration.
Recently, a brief upward movement provided a temporary boost to the prices of Bitcoin, Ethereum, and several significant altcoins. However, this surge lacked sustained momentum, and selling pressure swiftly drove prices back into established ranges. Consequently, Ethereum, the second-largest cryptocurrency by market capitalization, has entered a crucial phase characterized by sharp price compression.
Current derivatives data reveals the underlying reasons for this ongoing consolidation. The market is seeing increased leverage on both sides, converting indecision into mounting pressure. Ethereum is no longer merely drifting; it is coiling, setting the stage for a significant move.
The ETH liquidation map illustrates the precarious state of the derivatives market, showcasing a significant accumulation of leveraged positions positioned on both sides of the current price. This creates a high-risk environment where even minor price movements could lead to forced liquidations and sudden spikes in volatility. Specifically, there is approximately $1.64 billion in short liquidations stacked above present price levels, while around $1.05 billion in long liquidations sits below. A shift of around 10% in either direction could potentially trigger a cascading effect of forced exits.
This scenario indicates a market primarily driven by leverage rather than conviction. When liquidation pressures build on both sides, Ethereum often experiences a choppy trading environment until a structural break occurs. When such a break does happen, the resulting price movement tends to be rapid and unforgiving.
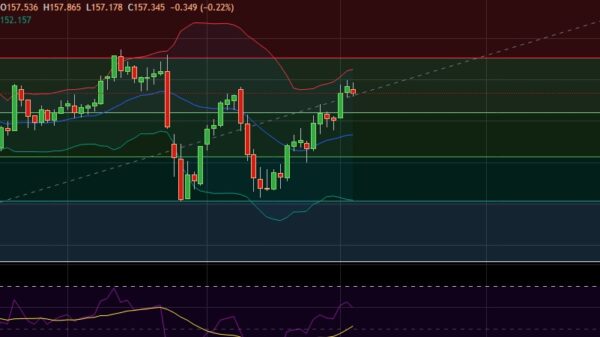
Currently, Ethereum“s price action is indicative of increasing indecision, with the asset trading within a tightening symmetrical triangle. This pattern typically emerges when buyers and sellers are evenly matched, signaling a period of volatility compression before a decisive move. On the daily ETH/USDT chart, the price action corroborates the warnings from liquidation data, as ETH fluctuates inside a symmetrical triangle formed by lower highs descending from the $3,300–$3,350 zone and higher lows ascending from the $2,850–$2,900 support area.
This compression reflects a balance in volatility, with both buyers and sellers matched while leverage builds quietly. Trading volumes remain subdued, reinforcing the idea that Ethereum is awaiting a significant trigger rather than trending organically. The Relative Strength Index (RSI) on the daily chart hovers near the neutral 50 level, indicating a lack of momentum extremes and confirming that ETH is in a wait-and-see phase rather than an overbought or oversold condition.
A breakout with an RSI push above 60 would likely coincide with a move above $3,300–$3,350, suggesting a bullish continuation. Conversely, a drop below 40 would align with a breakdown below $2,950–$2,900, increasing the risk of downside movement. Concurrently, the Chaikin Money Flow (CMF) remains slightly positive, indicating mild capital inflows, even as the price consolidates within the triangle. This suggests quiet accumulation rather than distribution.
If the CMF maintains a positive trend during a breakout, ETH could accelerate towards the $3,500–$3,600 range. However, if it shifts into negative territory, it would support a downside flush toward $2,700–$2,600. Together, the neutral RSI and positive CMF reinforce that Ethereum is coiled at a critical decision point, with indicators advocating for a reactive trading approach based on price confirmation rather than speculative anticipation.
As Ethereum approaches this critical juncture, the substantial $1 billion in liquidations positioned on both sides, combined with the price compression within a symmetrical triangle, suggests that the next move could be both sharp and definitive. ETH is currently not trending but rather coiling under significant leverage. A confirmed break above $3,300–$3,350 may initiate a short squeeze toward higher resistance levels, while a drop beneath $2,900 could prompt a rapid liquidation of long positions. For traders, exercising patience is essential; the advantage lies in reacting to confirmed price movements rather than trying to predict the direction.