


The Curve DAO Token (CRV) is showing signs of bullish momentum, with analysts projecting a price target between $0.55 and $0.72 by February. This optimism is contingent upon CRV successfully breaking through the significant resistance level at $0.45. If this occurs, traders may see potential gains ranging from 25% to 65% from current levels.
Recent sentiments from crypto analysts have leaned towards a positive outlook for CRV. Jessie A Ellis remarked on January 10, 2026, that “CRV price prediction shows bullish momentum building with analyst targets of $0.55-$0.72. Curve forecast indicates potential 33-75% upside from current $0.41 levels.” This view was echoed by Luisa Crawford on January 13, who highlighted the strong technical indicators suggesting a rally towards the anticipated price range. On January 15, Rongchai Wang reinforced this perspective, noting that “Curve (CRV) price prediction shows bullish momentum building as technical indicators align for potential breakout above $0.44 resistance toward $0.55-$0.72 targets.”
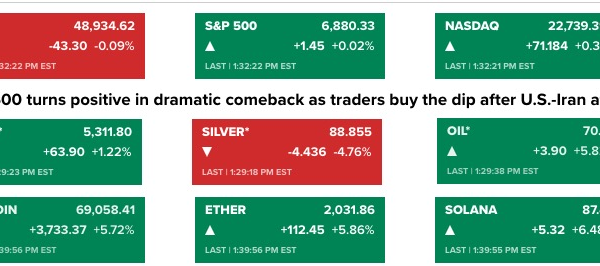
Technical analysis further supports the bullish sentiment. Currently trading at $0.44, CRV sits above all short-term moving averages, with the 7-day Simple Moving Average (SMA) at $0.42, the 20-day SMA at $0.41, and the 50-day SMA at $0.40. This arrangement typically indicates bullish momentum. The Relative Strength Index (RSI) reading of 58.43 suggests that there is still room for growth without approaching overbought conditions. However, the Moving Average Convergence Divergence (MACD) histogram indicating a value of 0.0000 hints at some bearish momentum in the short term, implying a possible consolidation phase before any significant price movement.
Analyzing the Bollinger Bands, CRV is positioned at 0.78 within the bands, facing immediate resistance at the upper band around $0.45, while the middle band, aligning with the 20-day SMA, establishes critical support at $0.41. The Stochastic indicators present %K at 86.29 and %D at 69.03, indicating that the token may be nearing overbought territory in the short term. Key trading levels reveal $0.45 as both immediate and strong resistance, while support levels are at $0.42 and $0.41.
In a bullish scenario, should CRV break above the $0.45 resistance level with significant volume, the path towards the $0.55-$0.72 target range would open up, corresponding to gains of 25% to 65%. The first price target of $0.55 aligns with historical resistance zones, requiring consistent buying pressure to maintain momentum. A move towards $0.72 would bring CRV closer to its 200-day moving average at $0.62, marking a substantial recovery from its current levels.
Conversely, should CRV fail to surpass the $0.45 resistance and instead drop below the critical support level of $0.41, bearish targets may emerge. The lower Bollinger Band at $0.37 serves as the first downside target, potentially leading to further declines towards $0.35 or lower. Key risk factors include general weakness in the broader cryptocurrency market and a decrease in trading volume.
For those considering an investment in CRV, the current price around $0.44 presents a favorable risk-reward scenario. Conservative entries could focus on pullbacks to the $0.42-$0.43 range, which corresponds with immediate support levels. More aggressive traders may opt for positions upon a confirmed breakout above $0.45, targeting the analyst-predicted range of $0.55-$0.72. It is advisable to set stop-loss orders below $0.41 to mitigate downside risk.
In conclusion, the outlook for Curve appears increasingly optimistic, driven by both analyst predictions and technical indicators. While short-term momentum reflects a mix of signals, the convergence of analyst targets around the $0.55-$0.72 range suggests substantial upside potential for CRV. The key factor remains a decisive breakout above the $0.45 resistance, which could trigger the expected rally. However, failure to breach this level might result in continued consolidation or potential declines towards $0.37-$0.41.
Disclaimer: Cryptocurrency price predictions are highly speculative and subject to extreme volatility. This analysis is for informational purposes only and should not be considered financial advice. Always conduct your own research and risk assessment before making investment decisions.