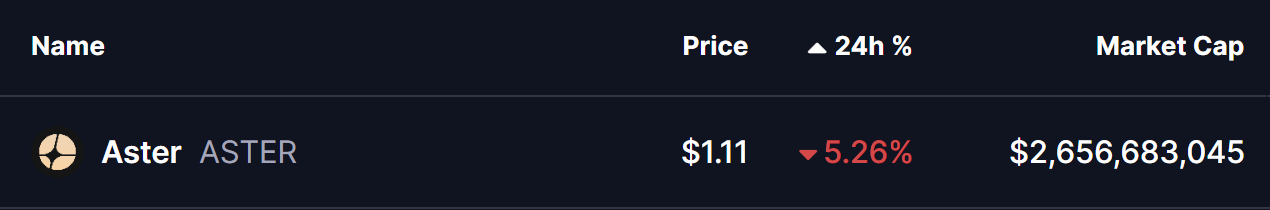
The cryptocurrency market is trying to stabilize at the beginning of the new week after a tumultuous period last week, which saw significant fluctuations that pushed Ethereum (ETH) down to a low of $2624, before rebounding above $2800. Despite this recovery among major cryptocurrencies, the decentralized exchange token Aster (ASTER) is exhibiting a troubling trend, losing over 5% of its value as it signals potential further declines.
On the 4-hour chart, ASTER has formed a classic head and shoulders pattern, a hallmark of bearish reversals in technical analysis. The left shoulder and head developed between November 15 and November 19, culminating at a peak of approximately $1.4068. The right shoulder, however, failed to reach similar heights, leading to increased selling pressure and a weakening of the neckline support.
The neckline, which was previously a multi-week support level situated at around $1.1464, has been decisively breached, confirming a structural breakdown. Following this breakdown, ASTER fell to $1.0682 before making a brief attempt at a retest.
This retest encountered substantial resistance at the $1.1576 level, coinciding with the 100-moving average, which further solidified the bearish outlook. As a result, the price has drifted back down to approximately $1.11, affirming the continuation of the downward trend.
Moving forward, as long as ASTER remains below both the neckline and the resistance at the 100-moving average, the market sentiment seems to favor sellers. A decisive move below the $1.0682 level could trigger a more pronounced downward momentum, possibly targeting $0.99 as the next significant downside level. However, should buyers manage to reclaim control and push the price above the 100-moving average at $1.1611, it could invalidate the bearish head and shoulders pattern and potentially initiate a recovery phase.
Investors are advised to remain vigilant, as the cryptocurrency landscape is known for its volatility and rapid shifts in momentum.
Disclaimer: The views and analysis presented in this article are for informational purposes only and reflect the author”s perspective, not financial advice. Technical patterns and indicators discussed are subject to market volatility and may or may not produce expected outcomes. Investors should conduct independent research and consider their personal risk tolerance before making decisions.