


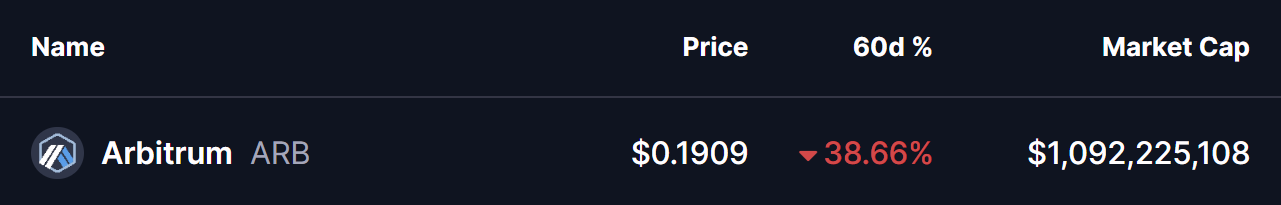
The cryptocurrency market has been experiencing tumultuous price movements in recent weeks, a trend that initiated following the significant sell-off on October 10. This downturn has notably impacted major cryptocurrencies, including Ethereum (ETH), which has seen a drop of nearly 23% over the past two months. Arbitrum (ARB) has not been immune to this trend, suffering a decline of over 38% in the same timeframe and struggling to regain any bullish momentum.
On the higher-timeframe chart, ARB appears to be forming a classic Power of 3 pattern, often associated with market bottoms and trend reversals. This formation unfolds in three distinct phases: accumulation, manipulation, and expansion. Typically, the most significant price movements are seen when the final phase commences.
Previously, ARB traded within a tight range, fluctuating between $0.2250 and $0.1914. This low-volatility environment, indicated by the grey box on the chart, marked the accumulation phase where selling pressure diminished and long-term investors began to enter the market, despite prevailing cautious sentiment. However, the structure eventually broke down in tandem with broader market weaknesses, causing ARB to fall below the $0.1914 support level and reach a local low around $0.1721 before attempting a modest recovery.
This sharp decline aligns with the manipulation phase of the Power of 3 pattern, where price movements often trigger stop-loss orders and lead to capitulation among weaker holders. Currently, selling pressure appears to be subsiding in this lower range, as recent candles indicate reduced downside momentum, hinting that a potential price base may be forming.
As of now, ARB is trading just below its previous support zone at approximately $0.1907. The price remains under the 30-period moving average, which is situated around $0.2074, acting as a critical short-term resistance level. This scenario places ARB in a wait-and-see position.
For a bullish scenario to unfold, ARB must reclaim the $0.1914 level and break above the moving average. A sustained recovery above these thresholds would likely indicate the end of the manipulation phase and the beginning of the expansion phase of the Power of 3 structure.
If buyers can successfully penetrate and maintain a position above the $0.2250 resistance, projections suggest a potential rally towards approximately $0.2779. This target coincides with previous structural resistance and represents a potential upside of about 45% from current levels.
However, the bullish narrative remains conditional. As long as ARB trades beneath the $0.2074 resistance, the risk of further downside persists, leaving the market susceptible to increased volatility. Maintaining recent lows and reclaiming critical resistance levels will be essential for bulls seeking to confirm a reversal in momentum.
Disclaimer: The analysis and views expressed in this article are for informational purposes only and do not constitute financial advice. Technical patterns and indicators are subject to market volatility and might not yield the expected outcomes. Investors should proceed with caution, conduct their own research, and make decisions that align with their individual risk profiles.