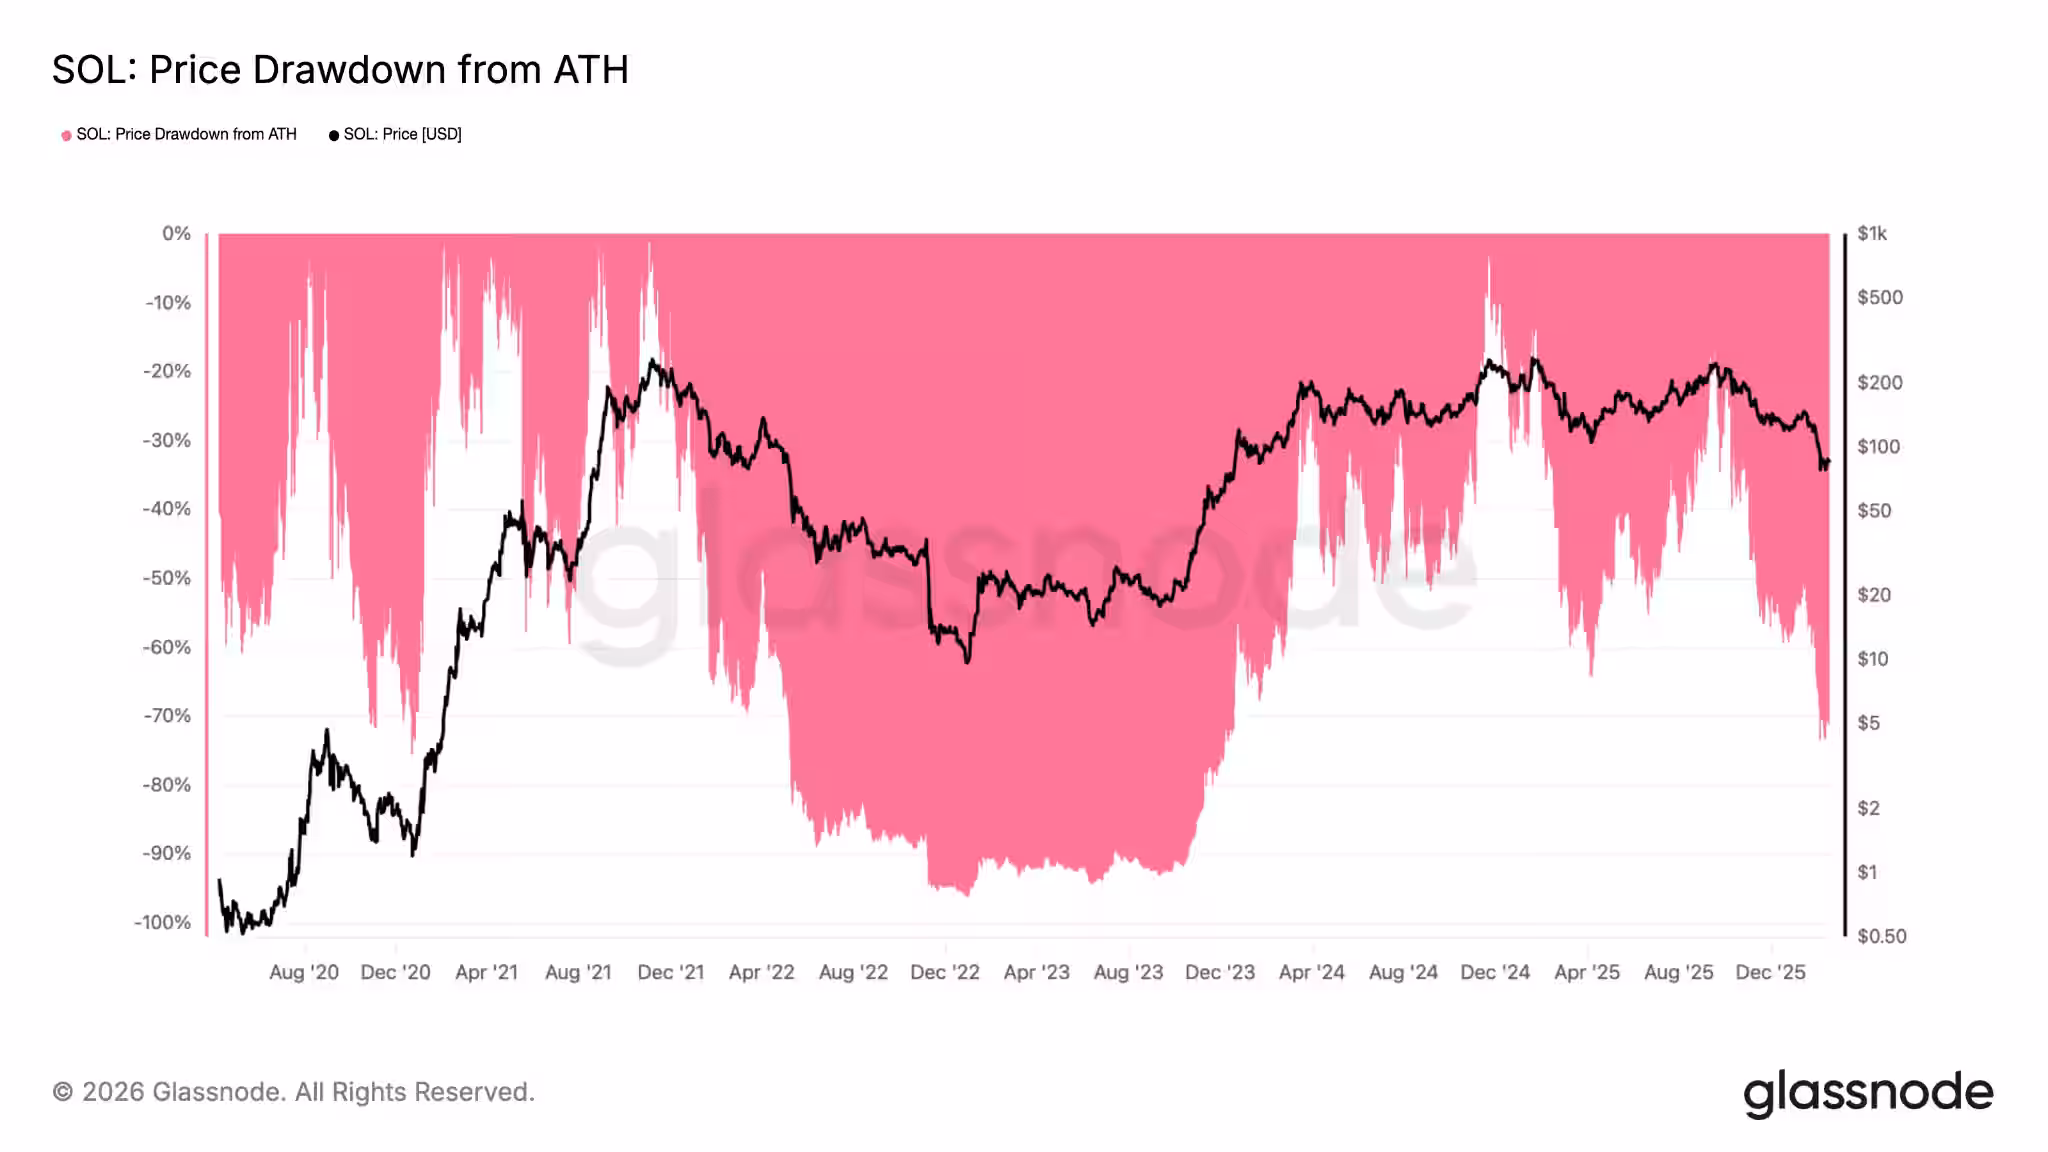
Recent weeks have been challenging for holders of Solana. After plunging to $67 on February 6, the token has found it difficult to recover. Currently, SOL is more than 72% below its all-time high of $295, marking a significant decline in a volatile market.
Technical analysis indicates that further downside may be imminent. The weekly chart suggests a confirmed head-and-shoulders pattern, a well-known bearish reversal formation. The neckline around $120 was breached in late January, leading to a shift in market momentum. The projected target from this pattern lies in the mid-$50s, with some analysts looking at a broader support range of $50 to $60.
On the daily timeframe, a bear flag formation raises additional concerns. A decisive close below $80 could trigger a move toward $48, representing a potential 40% drop from current price levels. The confluence of bearish signals across multiple timeframes is prompting traders to remain cautious.
Despite these warnings, not all indicators suggest a complete collapse. An intriguing metric is Solana”s MVRV (Market Value to Realized Value) pricing bands. This on-chain indicator compares the market cap with the value at which coins last changed hands. Historically, when SOL approaches or dips below the lowest MVRV band, it has often signaled long-term buying opportunities.
Previous instances, such as in March 2022, saw SOL rebound nearly 87% after reaching similar levels. However, the aftermath of the FTX collapse in November 2022 serves as a significant outlier. The association between Solana and the exchange led to an extreme breakdown, with SOL dropping to around $7. This episode illustrates that historically reliable on-chain signals can falter under systemic pressure.
On a more positive note, institutional interest in Solana appears resilient. US-based spot Solana ETFs, which launched in late October 2025, have experienced inflows in 66 of the last 74 trading days. This trend suggests that institutional investors are capitalizing on price weakness rather than shying away. Just this past Tuesday, spot SOL ETFs accumulated $2.9 million, bringing total inflows to $877 million. Additionally, Solana-linked exchange-traded products saw $31 million in net inflows during the week ending February 13.
The landscape for Solana remains vibrant, characterized by high throughput, low transaction costs, and a robust ecosystem of decentralized finance (DeFi) platforms and non-fungible token (NFT) projects. Recent months have also witnessed a resurgence in developer interest and social token experiments, bolstering network activity during this downturn.
However, broader macroeconomic factors, including tighter liquidity and heightened volatility across cryptocurrency markets, continue to impact risk assets. Typically, when Bitcoin experiences a downturn, altcoins like Solana are not spared.
Looking ahead, the $80 mark is crucial. If SOL fails to hold this level on a daily closing basis, the bear flag scenario becomes increasingly likely, placing $50 to $48 as the next significant area to watch. Conversely, if buyers can defend the current price levels and MVRV signals prove accurate, a relief bounce may be possible. This rebound could be further supported by ongoing ETF inflows and interest from bargain hunters.
Ultimately, the trajectory of Solana will depend heavily on broader market dynamics, Bitcoin”s price movements, and whether the growth of Solana”s ecosystem can foster renewed investor confidence. With volatility anticipated, the direction of SOL remains the primary concern.