The cryptocurrency community is abuzz with speculation surrounding a potential crash in 2026. Traders are questioning whether such a downturn is imminent or if it has already begun. Historically, significant declines in this market have followed a familiar pattern: Bitcoin reaches a cycle peak, market sentiment reaches its zenith, and then a major correction unfolds shortly thereafter. Thus, before delving into possible timelines for a crash, it is crucial to determine if Bitcoin has already reached its peak.
The traditional peak window has elapsed, yet critical indicators signaling a market high remain inactive. If Bitcoin”s peak is still forthcoming, it suggests that the window for a crash may extend into 2026.
The first clue pointing towards a potential crash lies in Bitcoin”s four-year supply cycle. The cryptocurrency operates on a predictable schedule where, after every 210,000 blocks, the block reward is halved. This reduction in supply typically leads to price increases over a span of twelve to eighteen months. Historical cycles reinforce this behavior: the 2012 halving resulted in a peak approximately thirteen months later, the 2016 halving peaked around seventeen months later, and the 2020 halving topped out after about eighteen months. Following this pattern, the upcoming halving on April 20, 2024, could indicate a peak between July and October 2025.
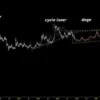
In early October 2025, Bitcoin even approached $126,000, appearing to reflect a classic cycle top. However, a critical confirmation was absent; the Pi-Cycle Top Indicator, which has accurately signaled every significant peak within a day or two, did not register a crossover. Consequently, the October high may be considered a mid-cycle peak rather than the ultimate top.
Two primary factors have contributed to the extension of this cycle beyond its expected timeframe. First, substantial inflows into exchange-traded funds (ETFs) have absorbed more supply than miners have been able to produce. Since early 2024, spot Bitcoin ETFs have attracted over $60 billion. Miners typically release approximately 13,875 BTC monthly, valued at roughly $1.4 billion at current market prices, while strong inflow periods saw ETFs absorbing $4 to $5 billion each month, thus removing new supply from circulation more swiftly than the network could generate it.
Second, a sustained increase in global liquidity has played a pivotal role. The money supply in major economies continues to grow by over six percent annually, with central banks having eased tightening measures and reserves remaining robust. This strong liquidity has delayed exhaustion in the market and provided ongoing support for risk assets.
As we analyze the timing of potential peaks, the Pi-Cycle Top Indicator emerges as a reliable forecasting tool. This indicator juxtaposes two moving averages: the 111-day average against twice the 350-day average. A crossover of these lines typically signifies that Bitcoin is on the verge of reaching a final top. As of November 11, 2025, projections for when these lines might intersect suggest a wide range of possibilities.
Considering the recent momentum of the 111-day average, which has increased between $200 and $400 daily, the crossover could occur anywhere from approximately 231 days to 462 days in the future. This means that the realistic timeframe for the Pi-Cycle crossover spans from June to September 2026, reinforcing the notion that the October 2025 high is unlikely to represent the cycle”s ultimate peak.
In conjunction with the Pi-Cycle Indicator, the Market-Value-to-Realized-Value (MVRV) Z-score offers further insights. The MVRV compares Bitcoin”s market valuation to its realized valuation, which reflects the average price at which coins last moved. Elevated MVRV levels indicate that holders are experiencing substantial unrealized profits, and historical cycles have typically peaked when MVRV surged into extreme zones. Presently, the warning zone for MVRV sits between 3.0 and 3.5.
If MVRV reaches 3.0, Bitcoin”s market cap could approach $3.39 trillion, equating to about $174,000 per coin. Should it hit 3.5, the market cap might rise to approximately $3.96 trillion, corresponding to around $203,000 per coin. These valuations signal a precarious market state.
Liquidity conditions also play a crucial role in determining how high Bitcoin can climb before facing a crash. The Global Liquidity Index (GLI), which tracks liquidity from major central banks and overall money supply, has historically influenced Bitcoin”s trajectory. As of November 2025, the GLI is near 75 and has been climbing at a rate of about four points monthly. Historical patterns suggest that GLI peaks occur around 90, potentially placing the next liquidity high between March and May 2026.
This analysis reveals a notable alignment in the indicators: MVRV is expected to overheat in spring 2026, the GLI is projected to peak around the same period, and the Pi-Cycle Indicator indicates a potential final top in the summer of 2026. This confluence of factors may lead to a classic bull trap, where liquidity peaks first, resulting in a market dip before Bitcoin attempts one final surge.
In summary, the convergence of these major indicators suggests a window for market peaks between March and August 2026. If Bitcoin follows historical patterns, a significant crash could initiate shortly after these peaks, with previous cycles indicating a decline of one to four weeks following the final top. Thus, a confirmed bear market may emerge between August and November 2026, marking the onset of a prolonged period of downside pressure.
In conclusion, while the $126,000 high in 2025 is not the ultimate cycle top, the true peak appears to lie ahead in 2026, with a crash window opening soon after.


