


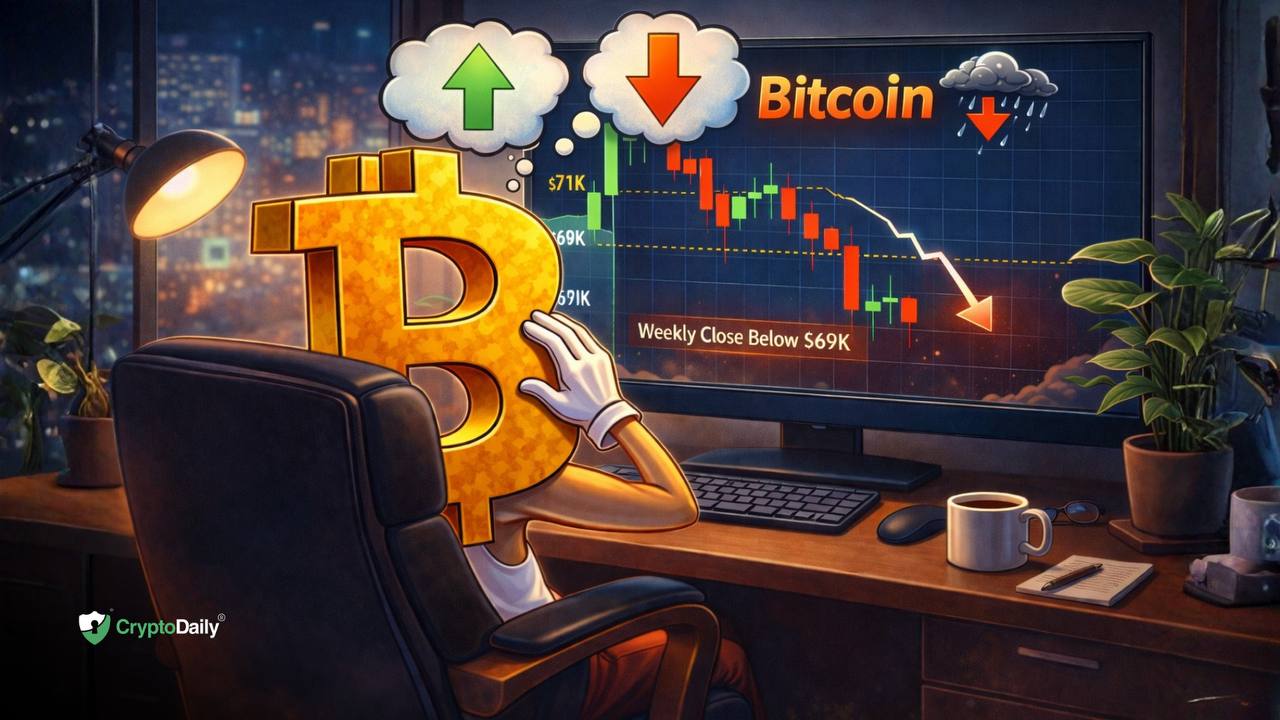
The recent weekly close for Bitcoin (BTC) below the significant $69,000 level has sparked a debate among traders and analysts. This development could signal the beginning of a new downward trend in the current bear market, or it might represent a temporary flush-out of investors who remain hopeful for a rebound. The pressing question remains: Is a recovery still feasible from this position, or has the market reached a critical juncture?
Current sentiment in the cryptocurrency space is notably bleak. According to the Crypto Fear & Greed Index from Alternative.me, the market is experiencing “Extreme Fear,” with a reading of just 5. This level of pessimism has only matched once before in the index”s history, a situation last seen in August 2019, when Bitcoin was navigating a bear market double bottom.
In examining the short-term price movements, the data indicates a troubling trend. The price of Bitcoin has not only failed to reclaim the crucial horizontal support at $69,000 but has also established lower highs and subsequently lower lows. This could be interpreted as a sign of weakening momentum, justifying the current negative sentiment among investors. Nonetheless, the formation of small descending channels suggests that this could also be a phase of absorption following a swift decline that has halved the value of Bitcoin in under five months.
Shifting focus to the daily chart reveals the emergence of a bearish descending triangle pattern. Typically, this formation does not bode well for bulls, and the prevailing expectation is for prices to break down through the triangle”s base. This level closely aligns with the horizontal support at $65,500. Should this pattern unfold as anticipated, the measured move could take Bitcoin down to approximately $58,300, marking another lower low while potentially setting the stage for a double bottom reversal.
Looking at the two-week chart, the challenges for bulls become even clearer. A candle body has firmly closed below the pivotal $69,000 level, now acting as resistance. However, there remains a slim chance for a bullish outcome if Bitcoin can manage to close above this threshold in the current two-week period. For now, the likely scenario points towards a continuation of the bear market or a lengthy bottoming process. Historical analysis indicates that Bitcoin may oscillate between the support and resistance levels defined by the previous bull flag, with the lower boundary set at $53,000.
As the cryptocurrency market grapples with these dynamics, one cannot ignore the potential influence of traditional assets such as gold and silver. With expectations for a resurgence in these precious metals, it raises the question of whether Bitcoin can maintain its position or risk stagnation as other asset classes experience upward momentum.
This article is intended for informational purposes only and should not be construed as legal, tax, investment, or financial advice.