


Bitcoin has shown significant upward movement today, bouncing back toward the $70,000 mark. This recovery comes in the wake of reduced geopolitical tensions and positive institutional news. However, the current market structure appears more like a phase of repair rather than a definitive breakout.
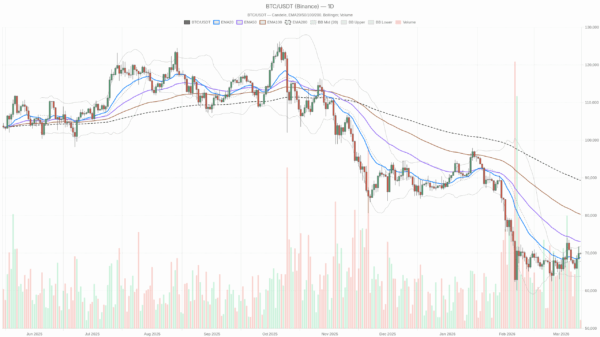
As observed on the daily chart, BTC is rebounding from local support levels and trading marginally above short-term moving averages. Yet, the higher timeframes reflect a market still digesting previous excessive movements. Presently, the primary market activity revolves around position adjustments, with dip buyers emerging but encountering a market that is still unwinding leverage after its latest ascent.
The broader macro context remains critical. The total cryptocurrency market capitalization has experienced a slight decline of 0.56% over the past 24 hours, while Bitcoin dominance stands elevated at 56.9%. Notably, market sentiment is entrenched in extreme fear, with the Fear & Greed Index at 15. This combination suggests that the recent uptick in Bitcoin”s price is more indicative of a defensive rotation into BTC rather than a widespread speculative risk-on sentiment.
On the daily timeframe, the price closed at $69,887, with the 20-day EMA at $68,771 and the 50-day EMA at $73,037. Although Bitcoin has reclaimed the 20-day EMA, it remains significantly below the 50-day and 200-day EMAs, which indicates a market in stabilization mode rather than confirming a new uptrend.
The Relative Strength Index (RSI) sits at 50.94, suggesting a neutral momentum state. Meanwhile, the MACD shows the MACD line at -778.76, slightly above the signal line of -1437.63, indicating that medium-term momentum is showing signs of improvement even though it remains lower than zero.
In terms of volatility, the daily Bollinger Bands show the mid band at $67,840, with prices trading just above this level, indicating a healthy bounce within the volatility envelope. The average true range (ATR) reflects daily volatility at $3,326, which is considered elevated but not extreme. Traders should be prepared for daily swings of approximately 4-5%.
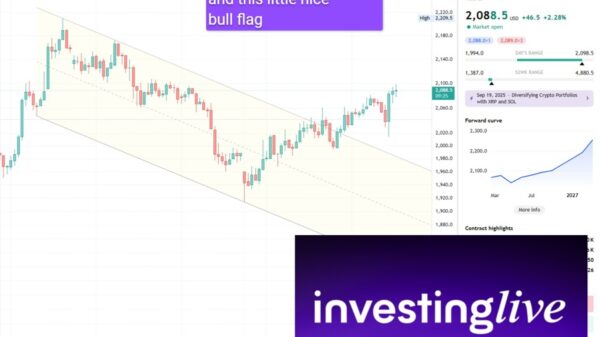
Looking at the hourly chart, the price is positioned between the 20-EMA and the 50-EMA, both of which suggest an upward trend overall. However, short-term momentum is beginning to cool, with the price hovering just below resistance around the $70,000 mark. This scenario often precedes either a minor breakout or a slight pullback.
In conclusion, while Bitcoin is indeed up today, the broader market sentiment appears cautious. The daily chart indicates a neutral-to-constructive stance, with the critical question being whether buyers can maintain momentum above the 20-day EMA to re-engage the 50-day EMA. Until there is a convincing move above $70,000 to $71,000, the market may continue to experience consolidation and volatility.