Bitcoin is currently navigating a significant resistance zone as it approaches the $95,000 level, amidst a notable decrease in spot supply on exchanges. While this trend reflects a bullish sentiment, the price is nearing a point where traders are likely to take profits. This situation sets the stage for either a breakthrough above this resistance or a potential corrective pullback into lower ranges.
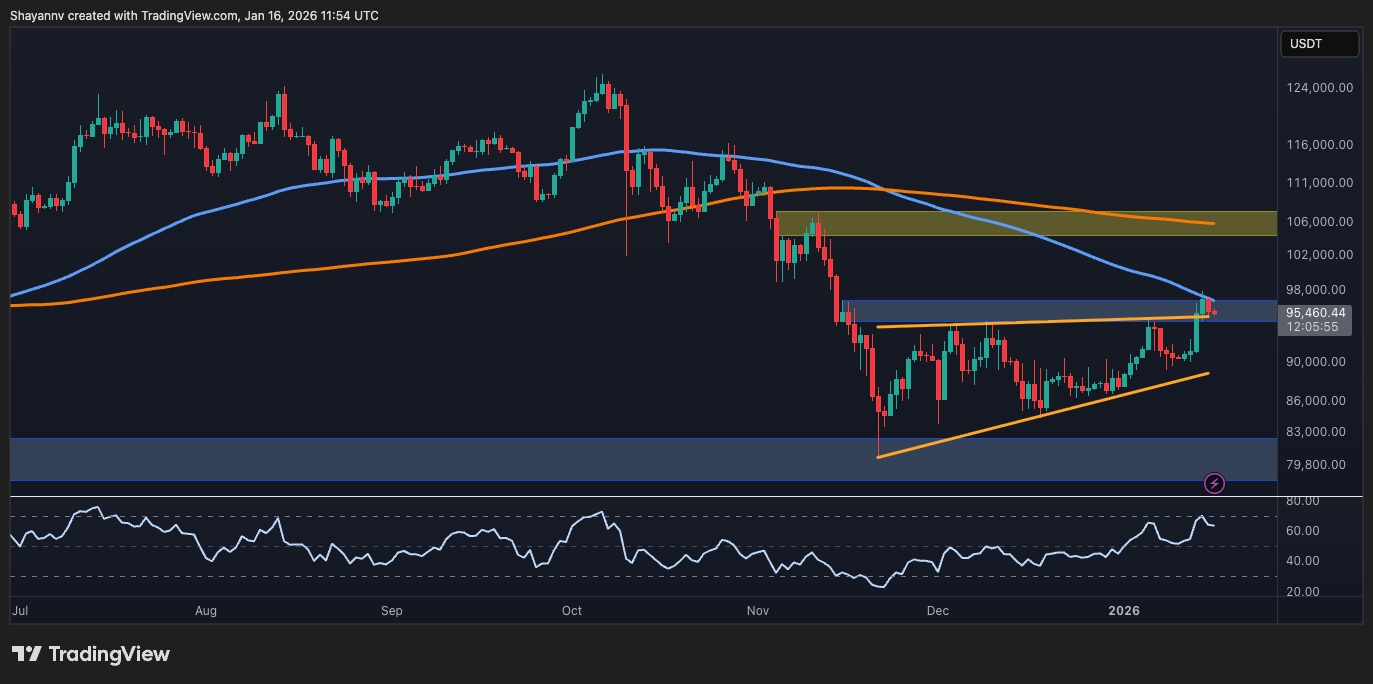
On the daily chart, BTC has rallied back into the $95,000 resistance band, coinciding with the 100-day moving average. This area has previously acted as a barrier, indicating that it remains a critical supply zone within the ongoing downtrend from earlier highs. The daily Relative Strength Index (RSI) is elevated but has not reached extreme levels, suggesting that while short-term momentum is robust, it still operates within a larger corrective framework. Should Bitcoin manage to break above the 100-day moving average and this resistance area, an upward movement toward the $106,000 mark and the 200-day moving average could signal the commencement of a new, prolonged bullish phase.
Analyzing the 4-hour chart reveals that the price has broken out from an ascending pattern and is currently consolidating at the peak of this formation, aligning with resistance on higher timeframes. However, momentum appears to be waning as candle sizes diminish and the RSI shows signs of rolling over from overbought conditions, indicating possible local distribution near the highs. If buyers fail to defend the breakout zone around $93,000 to $94,000, a pullback towards the lower trendline of the pattern and the $90,000 region may be on the horizon. Conversely, should BTC sustain levels above $93,000 to $94,000 and establish a solid base, another push toward the psychological resistance levels of $98,000 to $100,000 could be within reach. Nevertheless, quick follow-through from buyers is essential to avoid the risk of a false breakout.
On-chain analysis reveals a continuing decrease in exchange reserves, highlighting a trend where fewer bitcoins are held on exchanges, with more being stored in cold wallets or held by long-term holders. This scenario is typically viewed as a bullish indicator, reflecting supply tightness. While short-term corrections cannot be ruled out, particularly as the price presses against technical resistance, the prevailing on-chain sentiment suggests that any significant dips into the $80,000 to $90,000 range are more likely to attract buyers rather than signal a major distribution event. Unless there is a sudden influx of bitcoins returning to exchanges, the medium-term outlook remains optimistic, even if the price experiences some short-term downward movements to reset momentum.