


Bitcoin is currently experiencing a corrective phase following its inability to maintain a breakout above the mid-$90,000 range. The recent price dynamics resemble a pullback within an established range rather than indicating a definitive trend reversal. However, the rejection at significant moving averages and supply zones has tilted the short-term risk toward further consolidation and the possibility of additional downside tests before any potential recovery.
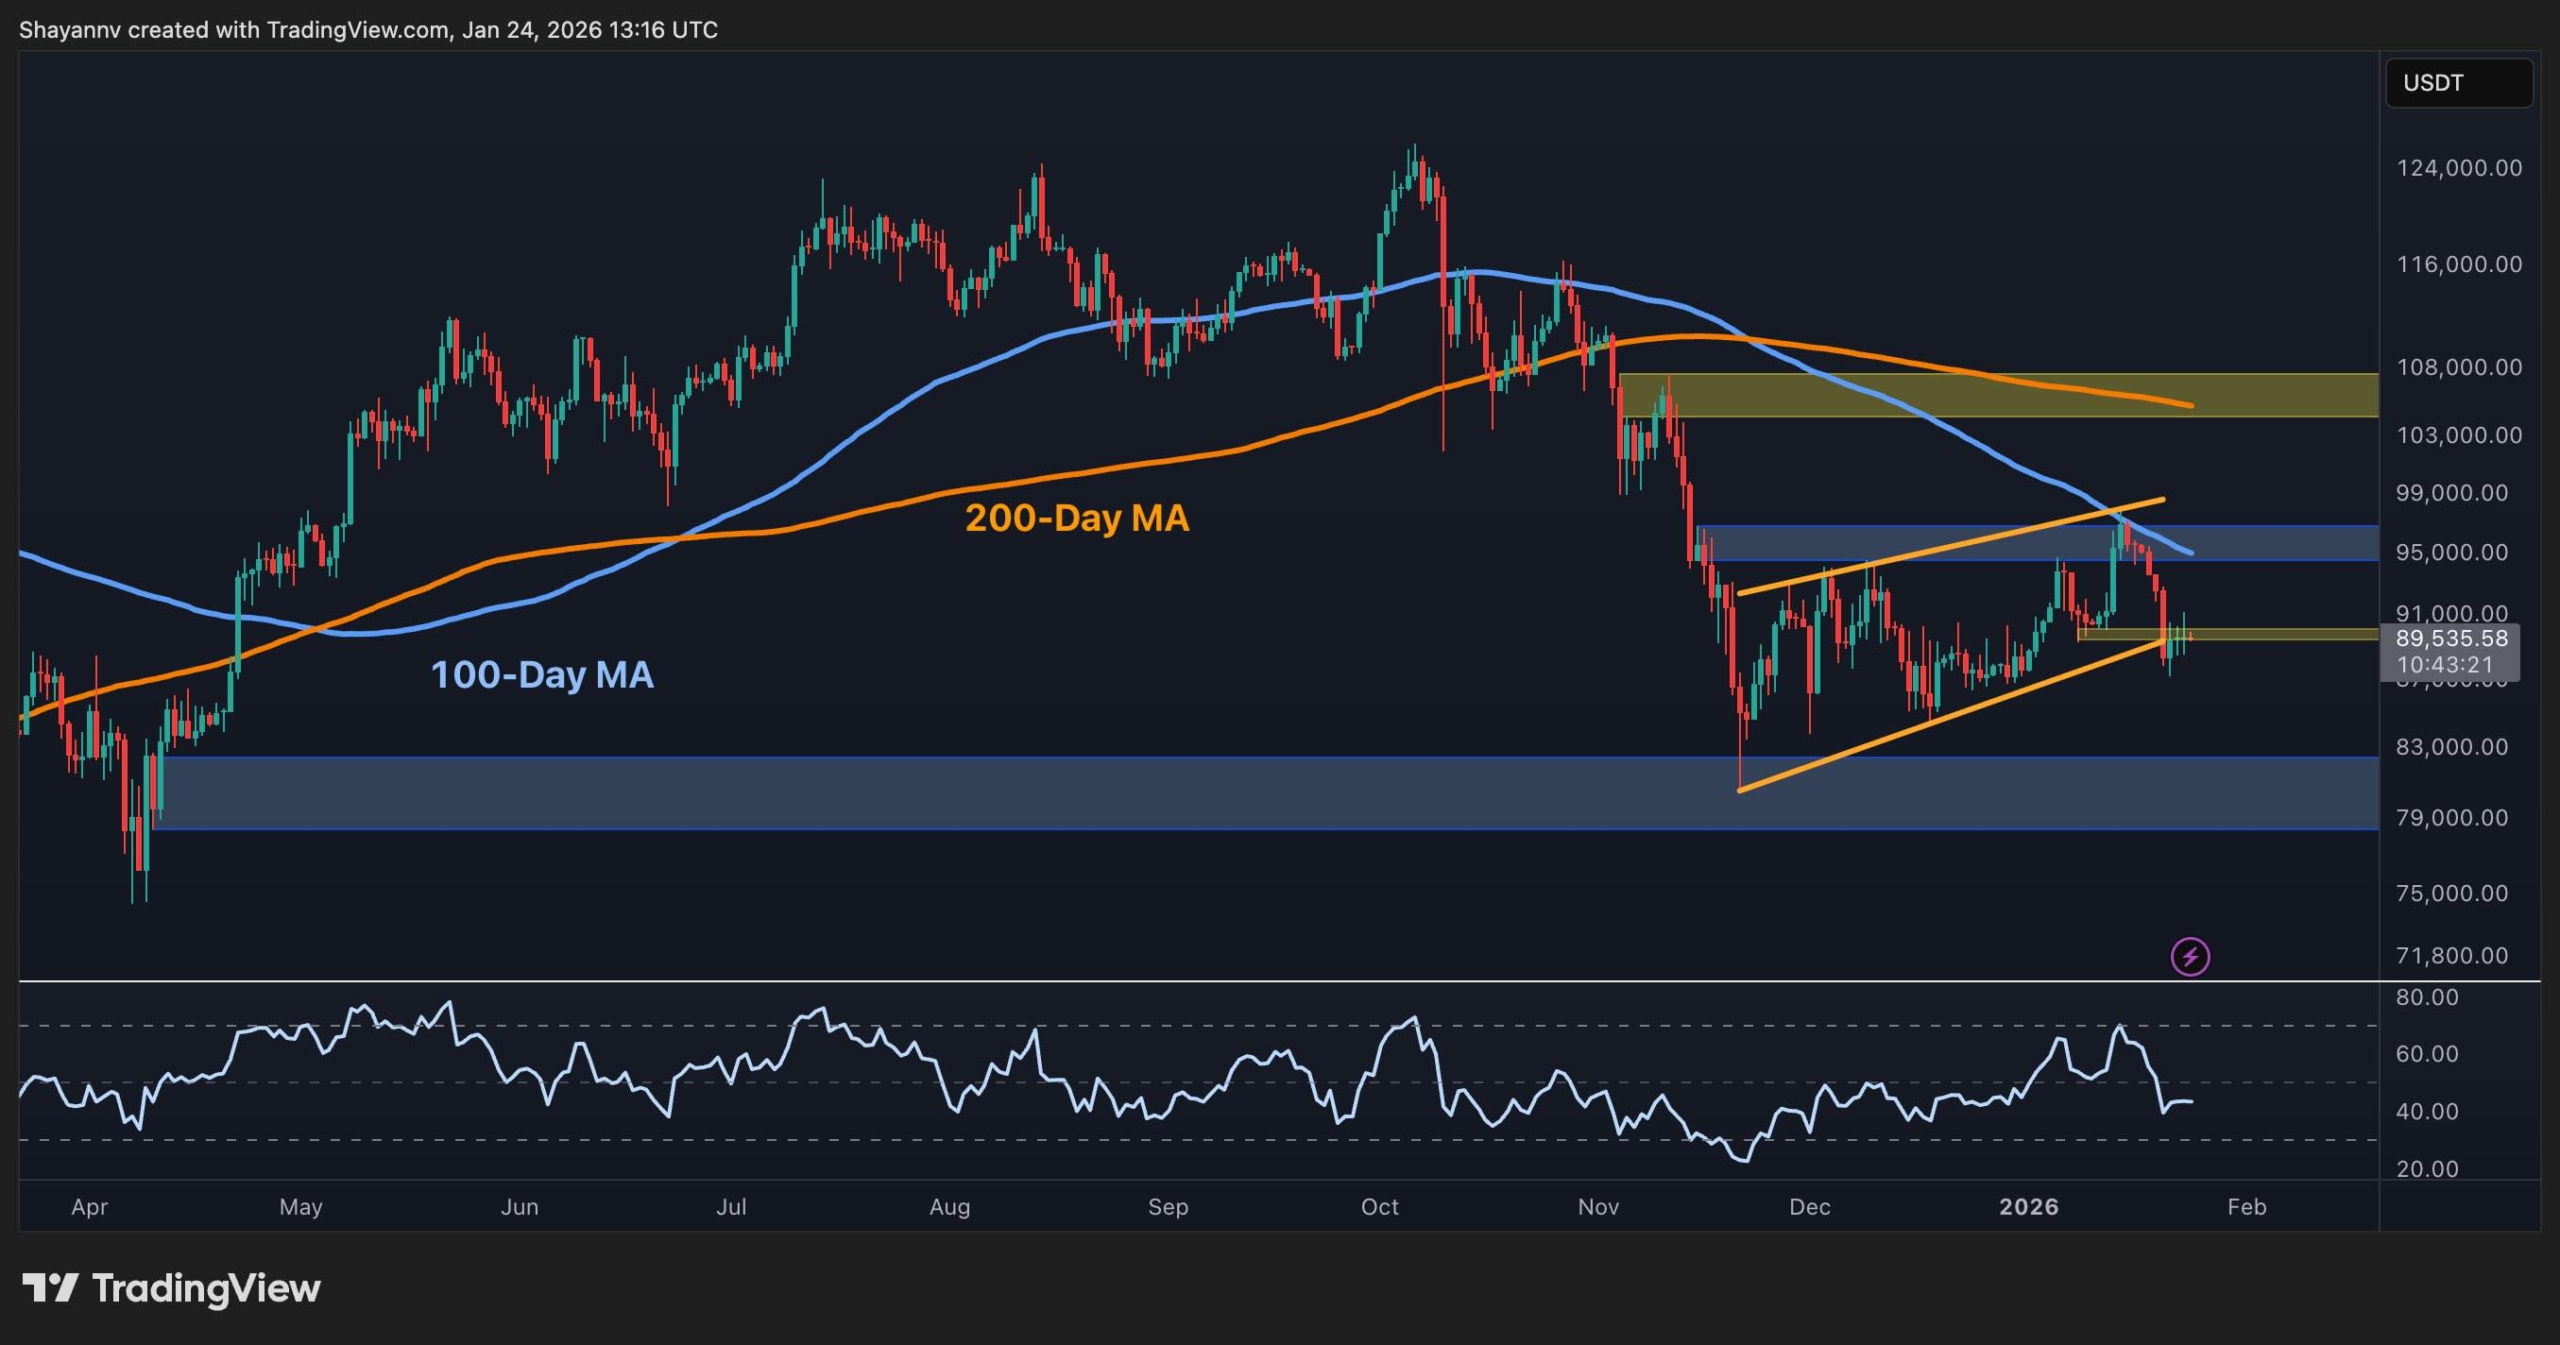
On the daily chart, Bitcoin has retreated from the resistance zone around $95,000, which aligns with the underside of the 100-day moving average and is situated below the declining 200-day moving average. The previous ascending wedge formation that emerged from the $82,000 demand zone has now broken downward, with the price trading near the former breakout level and local support around the $89,000 to $90,000 range.
As long as Bitcoin remains below the 100-day moving average and fails to reclaim the broken wedge structure, the broader outlook suggests a range between the $82,000 to $84,000 demand zone and the $95,000 to $97,000 supply zone. There is a risk of a deeper decline toward the lower boundary if upward bounces continue to be sold off.
The 4-hour chart indicates the breakdown from the rising channel that had supported the asset from approximately $84,000 to the recent high of $96,000. After losing the channel support and the intraday pivot at $90,000, the price has found tentative support just above the $88,000 to $89,000 area, which corresponds with the origin of the last impulsive move upward.
Momentum indicators on the 4-hour RSI have rebounded from oversold conditions but remain below previous highs, suggesting that the current recovery is merely corrective within a short-term downtrend. A sustained recovery above $92,000 could lead to a retest of $95,000. Conversely, failing to maintain support at $88,000 to $89,000 would significantly elevate the likelihood of a move toward the $82,000 daily demand area, or potentially lower.
On-chain analysis reveals that the adjusted spent output profit ratio (aSOPR) and its 30-day exponential moving average have been trending downward for several months, moving from levels above 1.03–1.04 down to below the neutral band around 1.00. This trend suggests that realized profits from spent outputs have been steadily decreasing, with a growing proportion of coins being sold near breakeven. Intermittent periods of realized losses occur when the aSOPR dips below 1.
Such a decline in realized profitability typically signifies a late-cycle or post-euphoric phase where speculative excess is unwinding, and weaker hands are gradually exiting the market. If the aSOPR stabilizes around 1 while the price maintains higher-timeframe support, it would indicate a healthier, more balanced market flushing out marginal sellers without widespread capitulation. On the other hand, a consistent drop of the 30-day exponential moving average of the aSOPR below 1 would suggest a more extensive profit-taking and loss-realization process, consistent with a prolonged corrective phase.