


The current price action of Bitcoin (BTC) has seen a notable drop to around $89,560, prompting speculation about a potential reversal. The critical support level at $90,000 remains intact for now, raising questions about whether BTC might rebound towards the $94,000 resistance level in the coming days.
Analyzing the 4-hour chart, BTC appears to be testing the lower bound of a small bull flag pattern. This technical formation presents a clear point of contention: the price is poised to either break down through the support or bounce back. Should the bears prevail and push the price below this level, further support lies with a major trendline and additional horizontal support beneath.
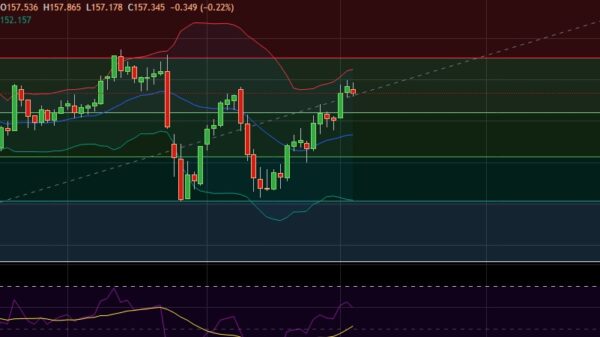
In the event of a bounce, the price could target the upper limit of the bull flag, creating the potential for a breakout. The Stochastic RSI indicators suggest a bullish sentiment, as they are currently positioned near the lower range of their threshold.
As BTC approaches the bottom of the bull flag and tests the $90,000 support, the RSI is also nearing a critical uptrend line. A failure here could indicate further downside movement in price. However, there is another layer of support available, characterized by the bottom of the bear flag, the major ascending trendline, and the $88,000 horizontal level. A sudden dip to these support levels is a possibility.
Despite the current bearish pressure, the multitude of support levels suggests a potential turnaround could be on the horizon. The next few hours will be pivotal for determining BTC”s trajectory.
From a broader perspective, the weekly chart emphasizes the significance of maintaining a position above the ascending trendline and the $90,000 support. Successfully holding this level until the end of the week would solidify it as a robust support level on a higher time frame, setting the stage for a potential price increase. A breakout from the green ascending triangle could propel BTC towards the critical $108,000 resistance, indicating a significant challenge for bulls.
Observations from the MACD at the bottom of the chart reveal that the indicator lines are beginning to straighten out and trend horizontally, while the pink histogram bars are diminishing in size. This trend hints at a bullish phase looming ahead, although the extent of this bullish momentum remains to be seen.
As the market awaits the outcome of these technical signals, traders and investors should keep a close watch on BTC”s performance around these key support levels.