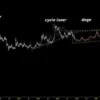
Bitcoin (BTC) has recently experienced a notable decline, slipping below the $100,000 mark, which has raised alarms among investors regarding emerging market trends. As of November 15, the BTC/XAU ratio has decreased by 10.45% over the week, along with a 4.8% drop below its 200-week exponential moving average (EMA). This particular break is recognized as a significant indicator that has historically marked the low points within major Bitcoin cycles over the past decade.
The BTC/XAU ratio has fallen below the 200-week EMA only four times since 2015, each instance coinciding with macro low points in Bitcoin prices. The recent break in November 2025 is categorized as the fifth occurrence of this trend. Previous instances, such as in 2015-2016, saw the ratio remain under the EMA for 203 days, with Bitcoin eventually bottoming out in the $200-$300 range before surging over 6,000% by the peak in 2017. Similar patterns have emerged during the downturns of 2018, the pandemic crash in 2020, and the end of 2022 when Bitcoin dipped to $15,500.
Should these historical patterns continue, Bitcoin might enter a consolidation phase lasting between 4 to 12 weeks following this latest break. Additionally, Bitcoin is currently facing a critical structural test on its weekly chart. For the first time in a while, Bitcoin has closed below its 50-week EMA, raising the potential for a retracement towards the $83,724 level, which served as a strong support during the rally in 2024. If this week”s close remains beneath the 50-week EMA, persistent selling pressure could drive prices down into the mid-$80,000 range.
However, it is important to note that the bullish outlook is not entirely extinguished. In recent years, Bitcoin has temporarily dipped below the 50-week EMA in July 2024, September 2024, and April 2025, only to rebound significantly afterward. These movements often trapped a number of sellers and triggered new upward trends. A similar “long wick” scenario could manifest now, potentially bolstering a short-term bullish outlook if the price manages to reclaim the 20-week EMA.
Compounding these technical indicators, there is a growing conversation regarding the slowdown in institutional demand. Inflows into spot Bitcoin ETFs in the U.S. have diminished compared to previous months, particularly with a noted decline in inflows into funds managed by BlackRock and Fidelity. Nevertheless, limited outflows suggest that institutional investors are not fully exiting the market. Analysts hypothesize that if the BTC/XAU signal aligns with ETF inflows, a robust recovery might transpire in the first quarter of 2026.
In summary, while the technical indicators and correlation with gold imply that the current pullback could represent a cyclical correction, trading below the 50-week EMA indicates that short-term volatility may persist. Investors might interpret this period as a potential bottoming phase, guided by historical trends rather than succumbing to panic.


