Bitcoin is currently navigating a pivotal phase after a notable decline, having recently fallen into a historically significant demand area around $60,000. This downturn comes amid broader market uncertainty, heightening the importance of the upcoming sessions for determining the cryptocurrency”s direction in the short to mid-term.
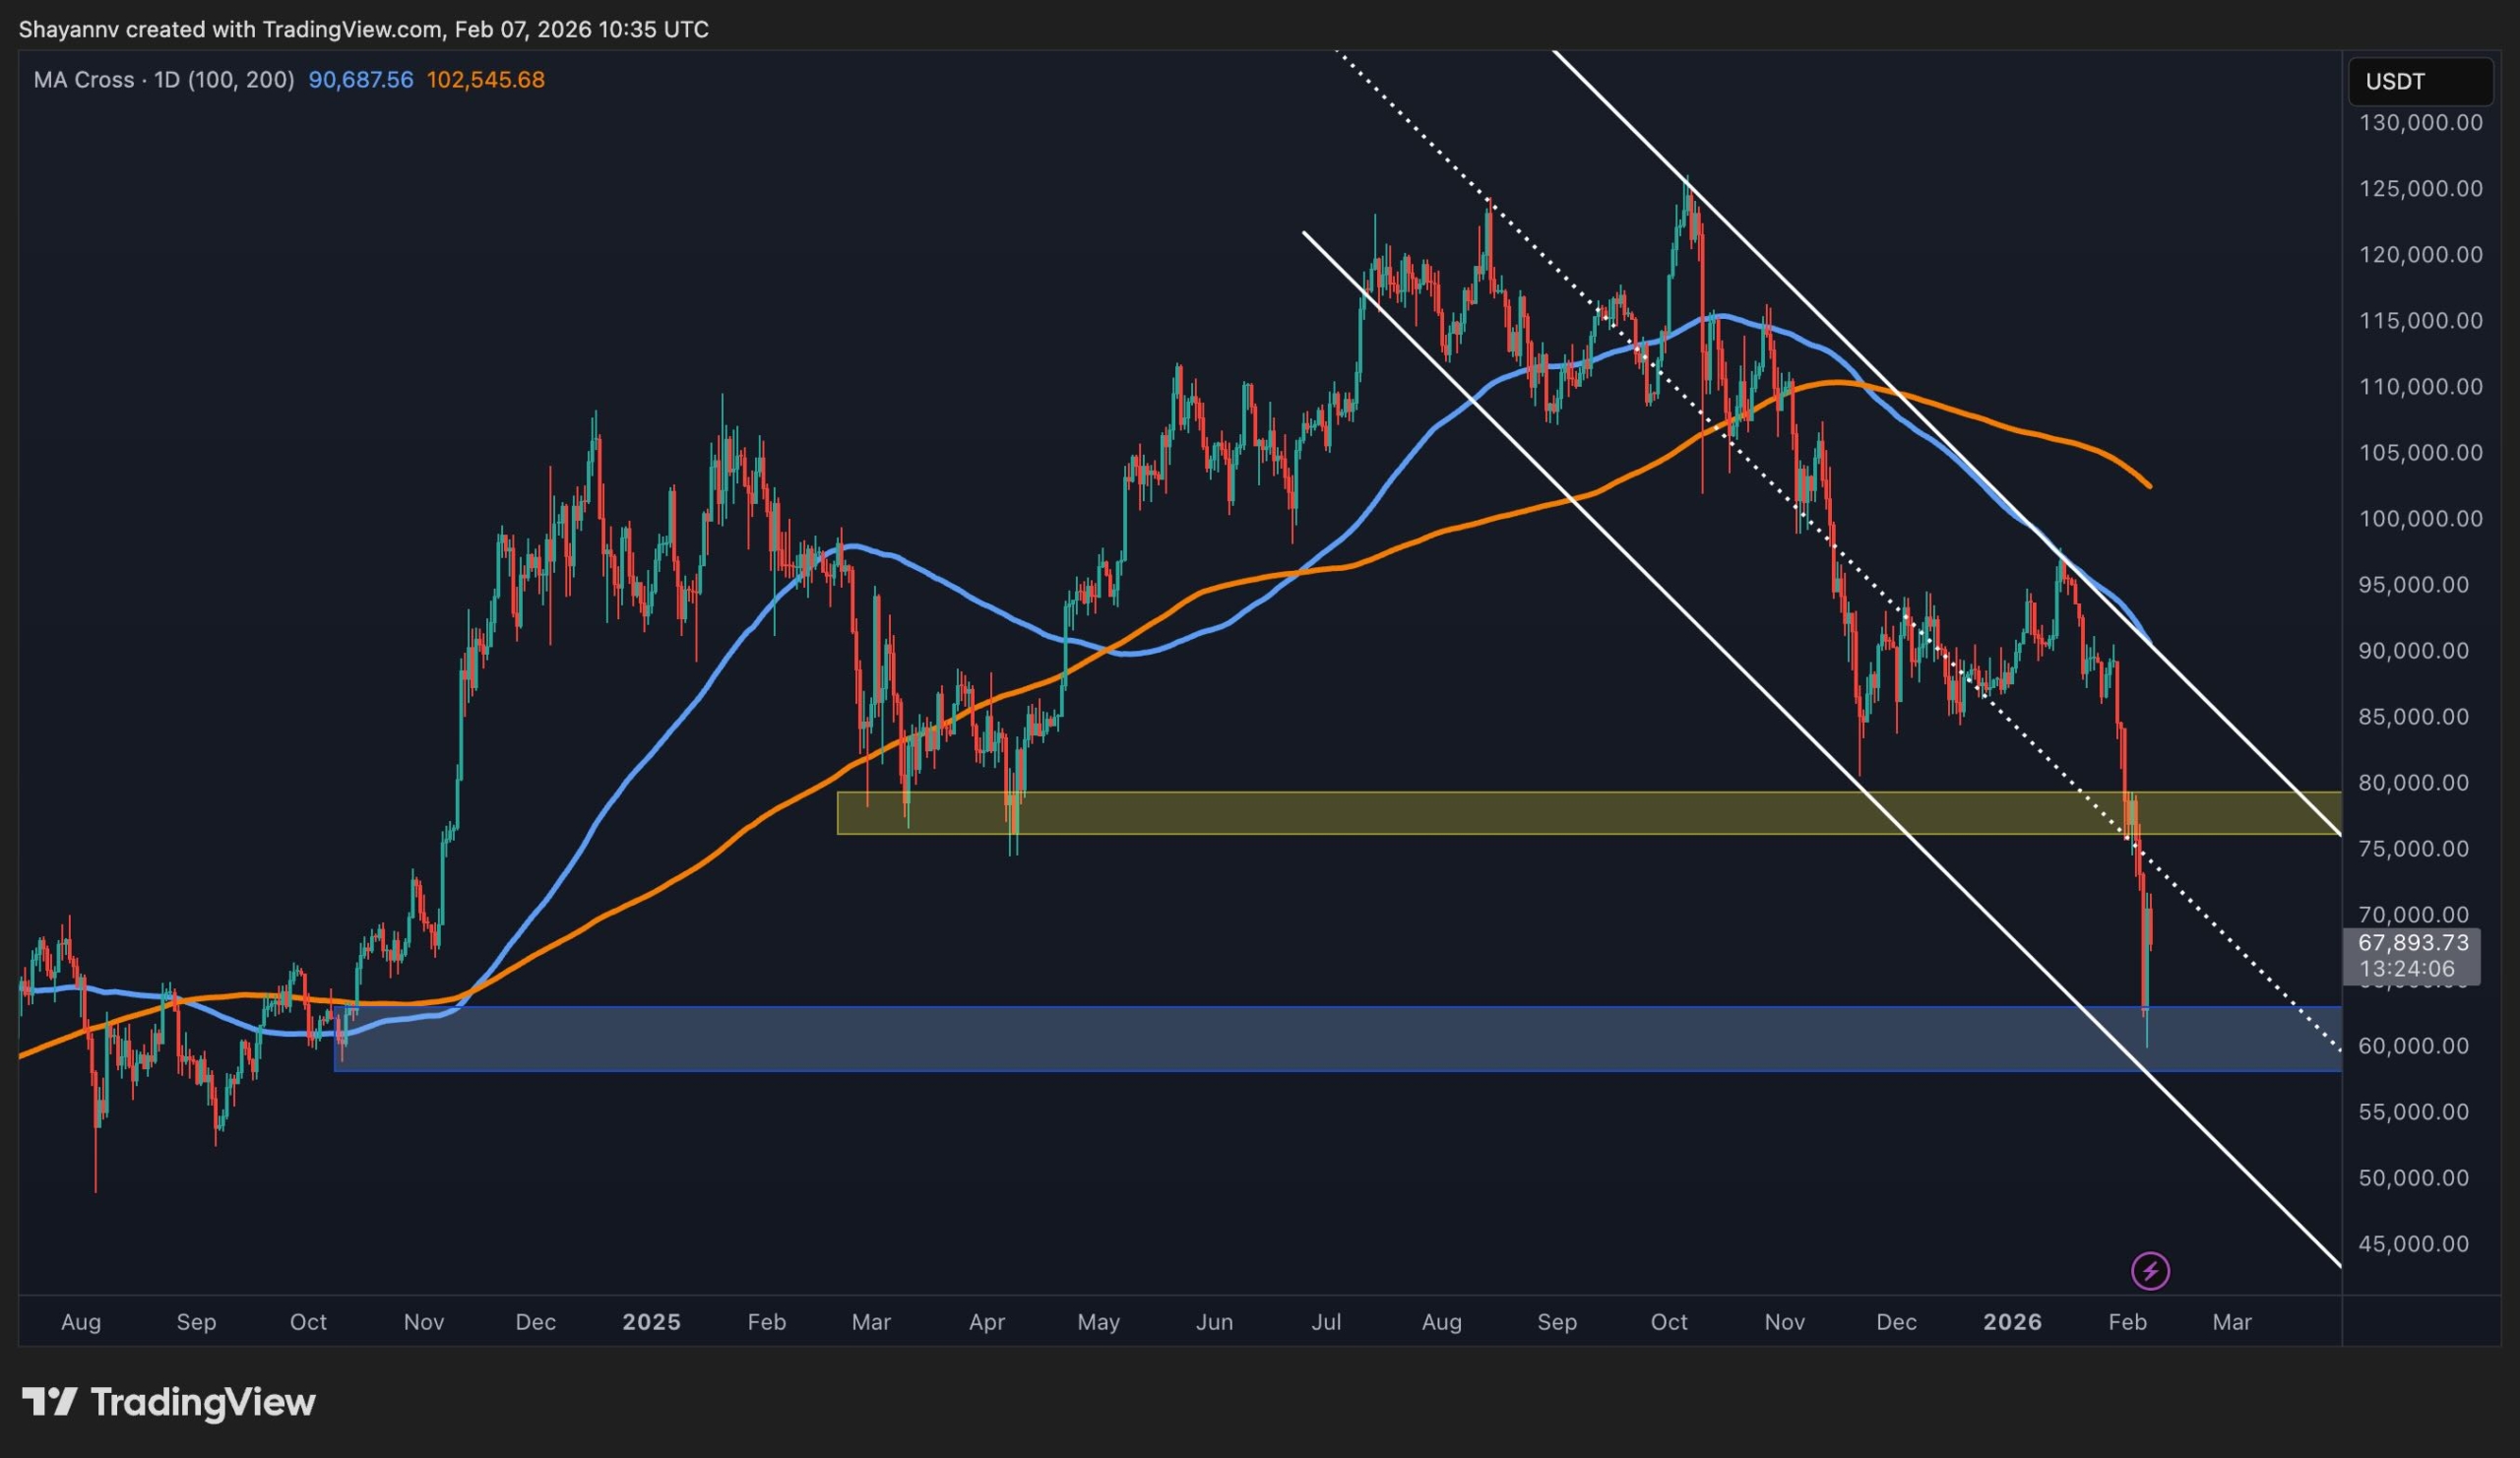
Analyzing the daily chart, it is evident that Bitcoin has breached its recent structural support, adhering to a descending channel. The failure to maintain momentum at the $75,000 level indicates that sellers are firmly in control of the market. Now, as Bitcoin tests the lower boundary of this channel, it finds itself at a crucial demand zone, which previously served as a strong support base earlier in its cycle.
This $60,000 demand area is particularly noteworthy as it represents the last significant consolidation before the prior impulsive price surge. Historical price action suggests this zone”s importance; however, the aggressive nature of the current price interaction suggests that any potential bullish response from this level might only manifest as a corrective bounce rather than a full trend reversal.
As long as Bitcoin remains beneath the resistance of the descending channel and the moving averages spanning 100 and 200 days, the overall market structure remains bearish. The risk of further downside persists if the current demand fails to absorb selling pressure effectively.
Shifting focus to the 4-hour chart, the bearish trend is even more pronounced. The latest price action shows a marked sell-off leading into the $60,000 psychological support, which was followed by a minor rebound that has not yet demonstrated significant strength. The immediate resistance level worth monitoring is the supply zone around $75,000, established during the last major price breakdown. Any attempted recoveries are likely to encounter resistance as Bitcoin approaches this area, particularly if trading volume and momentum remain low.
In terms of sentiment analysis, the liquidation heatmap reveals critical context for understanding recent price movements. A dense concentration of liquidity exists within the $60,000 to $65,000 range, aligning closely with current prices. This clustering is indicative of forced liquidations from over-leveraged long positions during the recent downturn.
As Bitcoin approaches this liquidity zone, the intensity of liquidations appears to diminish compared to prior levels, suggesting that much of the downside leverage has already been cleared. This could potentially increase the likelihood of a short-term stabilization or a rebound, particularly if selling pressure begins to wane.
However, it is essential to note that the absence of considerable liquidation clusters above the current price levels indicates limited upside liquidity in the near term. This reinforces the notion that any rebound from this area is more likely to be corrective rather than indicative of a significant trend shift.
Overall, while the prevailing market structure leans towards bearishness, the confluence of robust historical demand and reduced liquidation pressure may provide Bitcoin with a chance to initiate a relief rally or a period of consolidation from the $60,000 zone.